
Your marketing report is a snapshot of your business—showing which campaigns drive results, where you should invest more budget, and how to fix what isn’t working. It’s also a communication tool for sharing insights with bosses, clients, or other stakeholders who need to see evidence of your marketing success.
But how do you build a marketing report that’s both comprehensive and easy to digest?
In this post, we’ll explore what a marketing report is, the essential metrics to track, and best practices to make reporting faster and more effective.
By the end, you’ll know exactly how to create a marketing analytics report that helps you make data-driven decisions and secure buy-in for future campaigns. You’ll also be able to answer crucial questions like:
- How do you know if the marketing campaign you ran last quarter worked?
- How can you get your boss to approve more budget for certain tactics?
- How can you show clients that the work you do for them gets them customers?
- If campaigns are falling flat, why? What might you do to fix them?
What is a marketing report?
A marketing report is a collection of data from different marketing sources. It presents the performance of your business’s marketing efforts (including key performance indicators - or KPIs).
Marketing reports include information on:
- Marketing strategy (e.g. email marketing)
- Market research
- Promotions
- Ad and email campaigns
- Goals
- Expected outcomes
Good marketing reports give you all the data you need to make a decision and take action. The information needed to make a decision is (usually) less than the amount of data that you actually have.
In other words: you don’t have to include everything.
Before you start to compile marketing info and create the report, stop and ask yourself:
What is the purpose of this report? What are we trying to get out of it?
The information you include in your report will shape your marketing strategy – so it’s crucial to think about which metrics are tightly connected to the success of your business.
A marketing report without a purpose is just a set of lonely numbers.
"The most important thing you can do to avoid misjudging something’s importance is to avoid lonely numbers. Never, ever leave a number all by itself. Never believe that one number on its own can be meaningful. If you are offered one number, always ask for at least one more. Something to compare it with." – Hans Rosling in Factfulness
Benefits of marketing reporting
Some reasons to put together a marketing report are:
- Justify marketing expenses
- Advocate for more marketing budget
- Figure out which marketing channels work, so you can focus on them
- Explore the allocation of resources for marketing purposes
- Find holes in your marketing strategy
- Identify revenue-drivers
- Monitor progress over time
- Discover new avenues to try
There’s a fine line to walk. You need to include data that gives good, digestible insight. Information that you can use to tweak your existing strategy. But you don’t want to add every metric you have.
You want your team to view the report and have clear next steps. You don’t want them to be scratching their heads in confusion.
Simple is better.
What should a monthly marketing report include? (Examples)
Even after you’ve decided to create a marketing report – what information should you put in it?
And once you’ve decided which numbers to include – where can you find them?
Every marketing tool you use probably has its own “reporting,” and the list of metrics you could include is a mile long. Which metrics you choose depends on your goals, but there are a few must-have metrics that are a good idea for any business.
Here are six things to put in your marketing report (and where to find them):
- Goals
- SEO data
- Email marketing data
- Leads and customers
- Explanations
- Social media data
1. Goals
Begin with a reminder of what you’re working towards. Starting with the marketing department’s role in achieving the greater business goals gives the report a focus. It also gives your team some perspective. They’ll have something to compare the actual numbers to.
Be clear about your goals, and everything that follows will have more meaning. You’ll have a lens to see how each section fits into the bigger picture and contributes to the end game.
In each report, compare your progress towards your goal to the end goal. Possible goal targets include things like:
- Monthly or annual revenue
- Monthly traffic sources to your website (bonus: break it out by source of traffic)
- Your CSAT (customer satisfaction) score
- The number of leads you bring in each month
- Your conversion rate from new lead to new customer
Understanding where you are relative to those numbers will help you make adjustments to your marketing – before you fall too far behind to catch up.
Let everyone know why they’re doing what they’re doing, and then follow up with how they’re doing it.
2. Website analytics
Website analytics and SEO data give you the foundation to answer questions about your marketing strategy and website performance. It helps you understand how many people you reach through your website, and what they do on your website once they get there.
Here’s a good place to start:
- Your website traffic numbers – they tell you how many people are coming in contact with your business. Total site traffic numbers help visualize the size of your reach. The total traffic number gives you a frame of reference for your business’s position.
Then break it down further into the different types of traffic:
- Unique visitors – the number of individual people coming to your site, not total visits
- Paid vs. organic traffic – how many people are you driving to your site through ads, and how many are coming there naturally? If you’re paying for ads, how has the return on investment (ROI) been for them?
- Blog traffic – If you have a blog, how many people are reading it? Subscribing?
Once you have your traffic numbers laid out, shift to a different point of view. Zoom out for each of the current numbers and add a little context to the situation.
- Trends – What are the numbers like compared to last week? Last month?
Areas that are performing well and areas that aren’t
- Which pages are attracting the most visitors?
- Where are visitors consistently landing?
- Where should you double down to continue success?
- What needs to change to improve underperforming pages?
Each business is different. Your business might not do any search engine marketing (SEM). You may not be advertising so you have no paid traffic. Some businesses don’t have a blog.
You can include and exclude metrics as it makes sense.
Other SEO data points you might add to your marketing report are:
- Average visit duration – how long are people spending on your site? Several factors go into this metric:
- How engaging is your website?
- How long does it take to load?
- How well does your site match the intent of each visitor?
But where do you find these measures in the first place?
There are several website-traffic measuring services. One of the most popular (and also free) services is Google Analytics. Google Analytics gives you access to thousands of metrics for your website, and any pages associated with your domain.
Note: On July 1, 2023 Google Analytics accounts will be permanently shifted to Google's next-generation solution called GA4. Google will stop processing data from it's previous version Universal Analytics. You can visit Google's website to take a free course on how to use GA4.
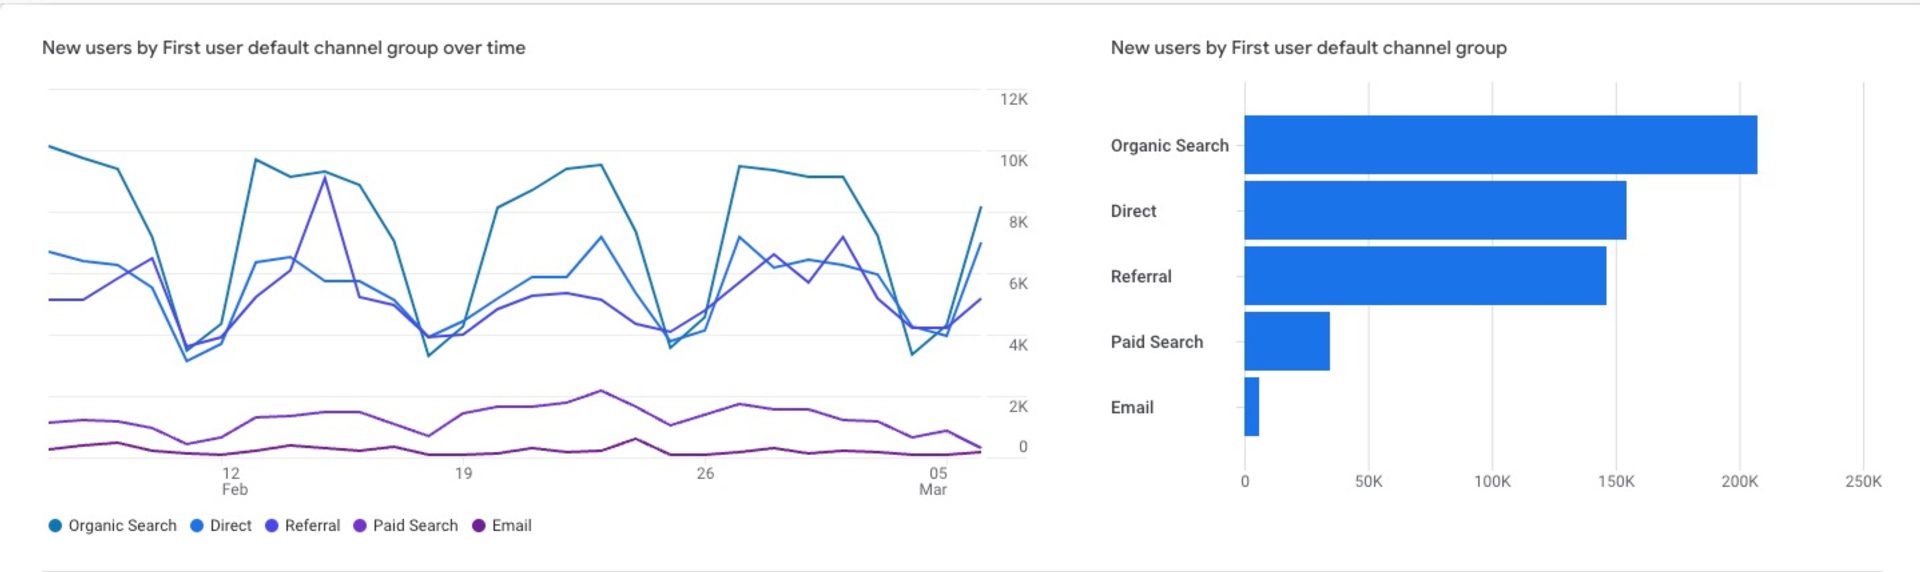
This is an example of a GA4 acquisition report. All your traffic numbers for the week in one place!
The homepage dashboard of Google Analytics shows you:
- Active users right now
- Active users in the last week
- Sessions
- Bounce rate
- Session duration
These tools give you the information you’ll include in the SEO data section of your marketing report. All you have to do is determine which data you want, find it, pull it, and put it in your report!
3. Email marketing data
SEO and website traffic metrics show the total number of visitors to your site. But what about the people who are actively engaged with and subscribed to your content?
Try it now, for free
The email marketing section shows how your web traffic converts into subscribers and leads. It lets your team know:
- How your outreach is going
- What messages are resonating
- Engaged contacts
- Popular products and services
The numbers and stats to include in this section are:
Emails sent
- How many emails did you send out to your subscribers or contacts?
Use these measurements and see which email campaigns had the best numbers. From there you can determine the types of messages that resonate with your audience the best.
- Are they about a certain product or service?
- What type of email created the most activity?
- Which email resulted in the most leads or new customers?
This information is especially valuable to the sales department because these emails impact the sales pipeline. If you learn that your audience is particularly interested in a product or service offering, your sales team can find new ways to work it into their conversations.
Where do you find this information?
You can find stats on your email campaigns through your email service provider (ESP). ActiveCampaign offers in-platform reporting on several aspects of your email marketing activity:
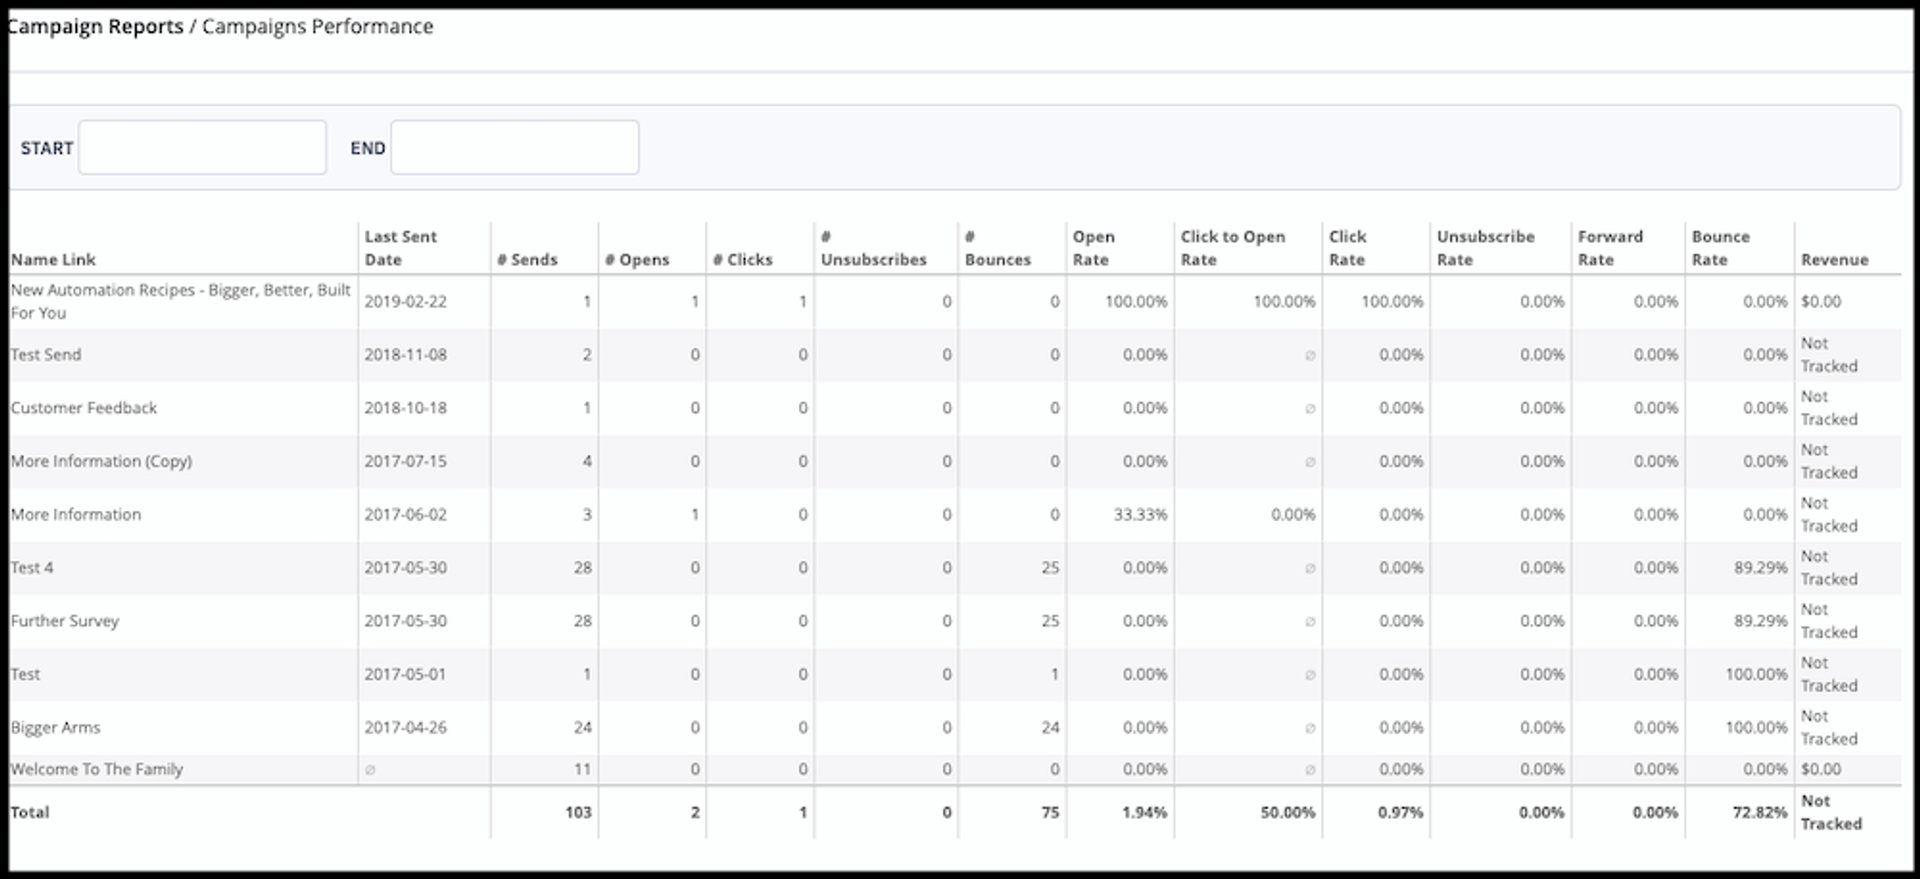
ActiveCampaign gives you both the hard numbers as well as the calculated rates for each campaign and automation you send on the platform.
Every ESP is different and offers different levels of reporting. But each should have access (and give you access) to your stats.
4. Leads and customers
How do the metrics in your marketing report become leads and customers?
In other words, how does all this stuff turn into $$$?
This section of the marketing report should include:
- Number of new marketing qualified leads (MQLs)
- Engaged contacts that are more likely to become customers than other contacts
Number of new sales qualified leads (SQLs)
- Contacts that show high levels of engagement and are ready to speak with sales
This section has the biggest connection to your business goals.
These numbers show what’s working and what isn’t. You’ll see the sources that are producing leads and customers for you (and you’ll see the channels that aren’t). Double down on those that are working, and figure out how to improve the sources that aren’t.
Where do you find this information?
To calculate MQLs and SQLs you’ll have to define what an MQL or SQL is for your business.
You can define MQLs and SQLs by:
- Engagement tracking
- Site tracking
- Form submissions
- Event attendees
- Free trial sign ups
How does a contact become a lead? How does a lead become a customer? What is the average level of engagement needed for each? When you define these, you have a method to measure how many you create.
In ActiveCampaign, you can set rules for contact scoring. When you reach a certain level of engagement, ActiveCampaign automatically labels them as a lead.
To calculate CAC – divide your total sales and marketing expenses by your number of new customers.
To calculate CPA – divide your total sales and marketing expenses by the number of conversions.
This section functions best at the very beginning or very end of the report. There are benefits to each. If you lead with this section then the sections that follow serve as an explanation. If you close the marketing report with it, it’s easy to see how these numbers came to be.
5. Explanations of the numbers
"Just as I have urged you to look behind the statistics at the individual stories, I also urge you to look behind the individual stories at the statistics. The world cannot be understood without numbers. And it cannot be understood with numbers alone." – Hans Rosling in Factfulness
Add some context. Don’t let the numbers hang out on their own, especially if they’re open to interpretation. You don’t want anyone to assume anything that’s incorrect when there’s more at play than meets the eye.
- Did you see a dip in organic traffic this month because of a holiday or a site issue? Explain that.
- Was there an email offer sent out that spiked your CTR? Let them know!
- Did you get a shout-out from a news site or an influencer that led to a flood of MQLs? That’s an important detail you should share with the class!
Written explanations of your metrics can help key stakeholders (your boss, executives, your peers) understand what’s really happening. Explaining interesting spikes or fluctuations helps them form an accurate impression of your marketing.
The worst-case scenario? You put all this work into pulling numbers and people get the wrong idea from them. Explanations prevent that.
6. Social media data
When should you include social media info in your marketing reports?
You should include social media in your reports if:
- You have brand awareness goals that social media reach is a part of
- You convert customers directly from social media (most commonly this is Instagram + an e-commerce business)
Social media platforms give great insights and analytics for your profiles:
- Followers
- Engagements
- Impressions
- Ad performance
- Virality
- Shares
- Audience demographics
This data helps you see how your audience responds to your message. The audience demographics information is especially valuable. You might find that your perceived target audience isn’t the audience that’s actually engaged with your content marketing.
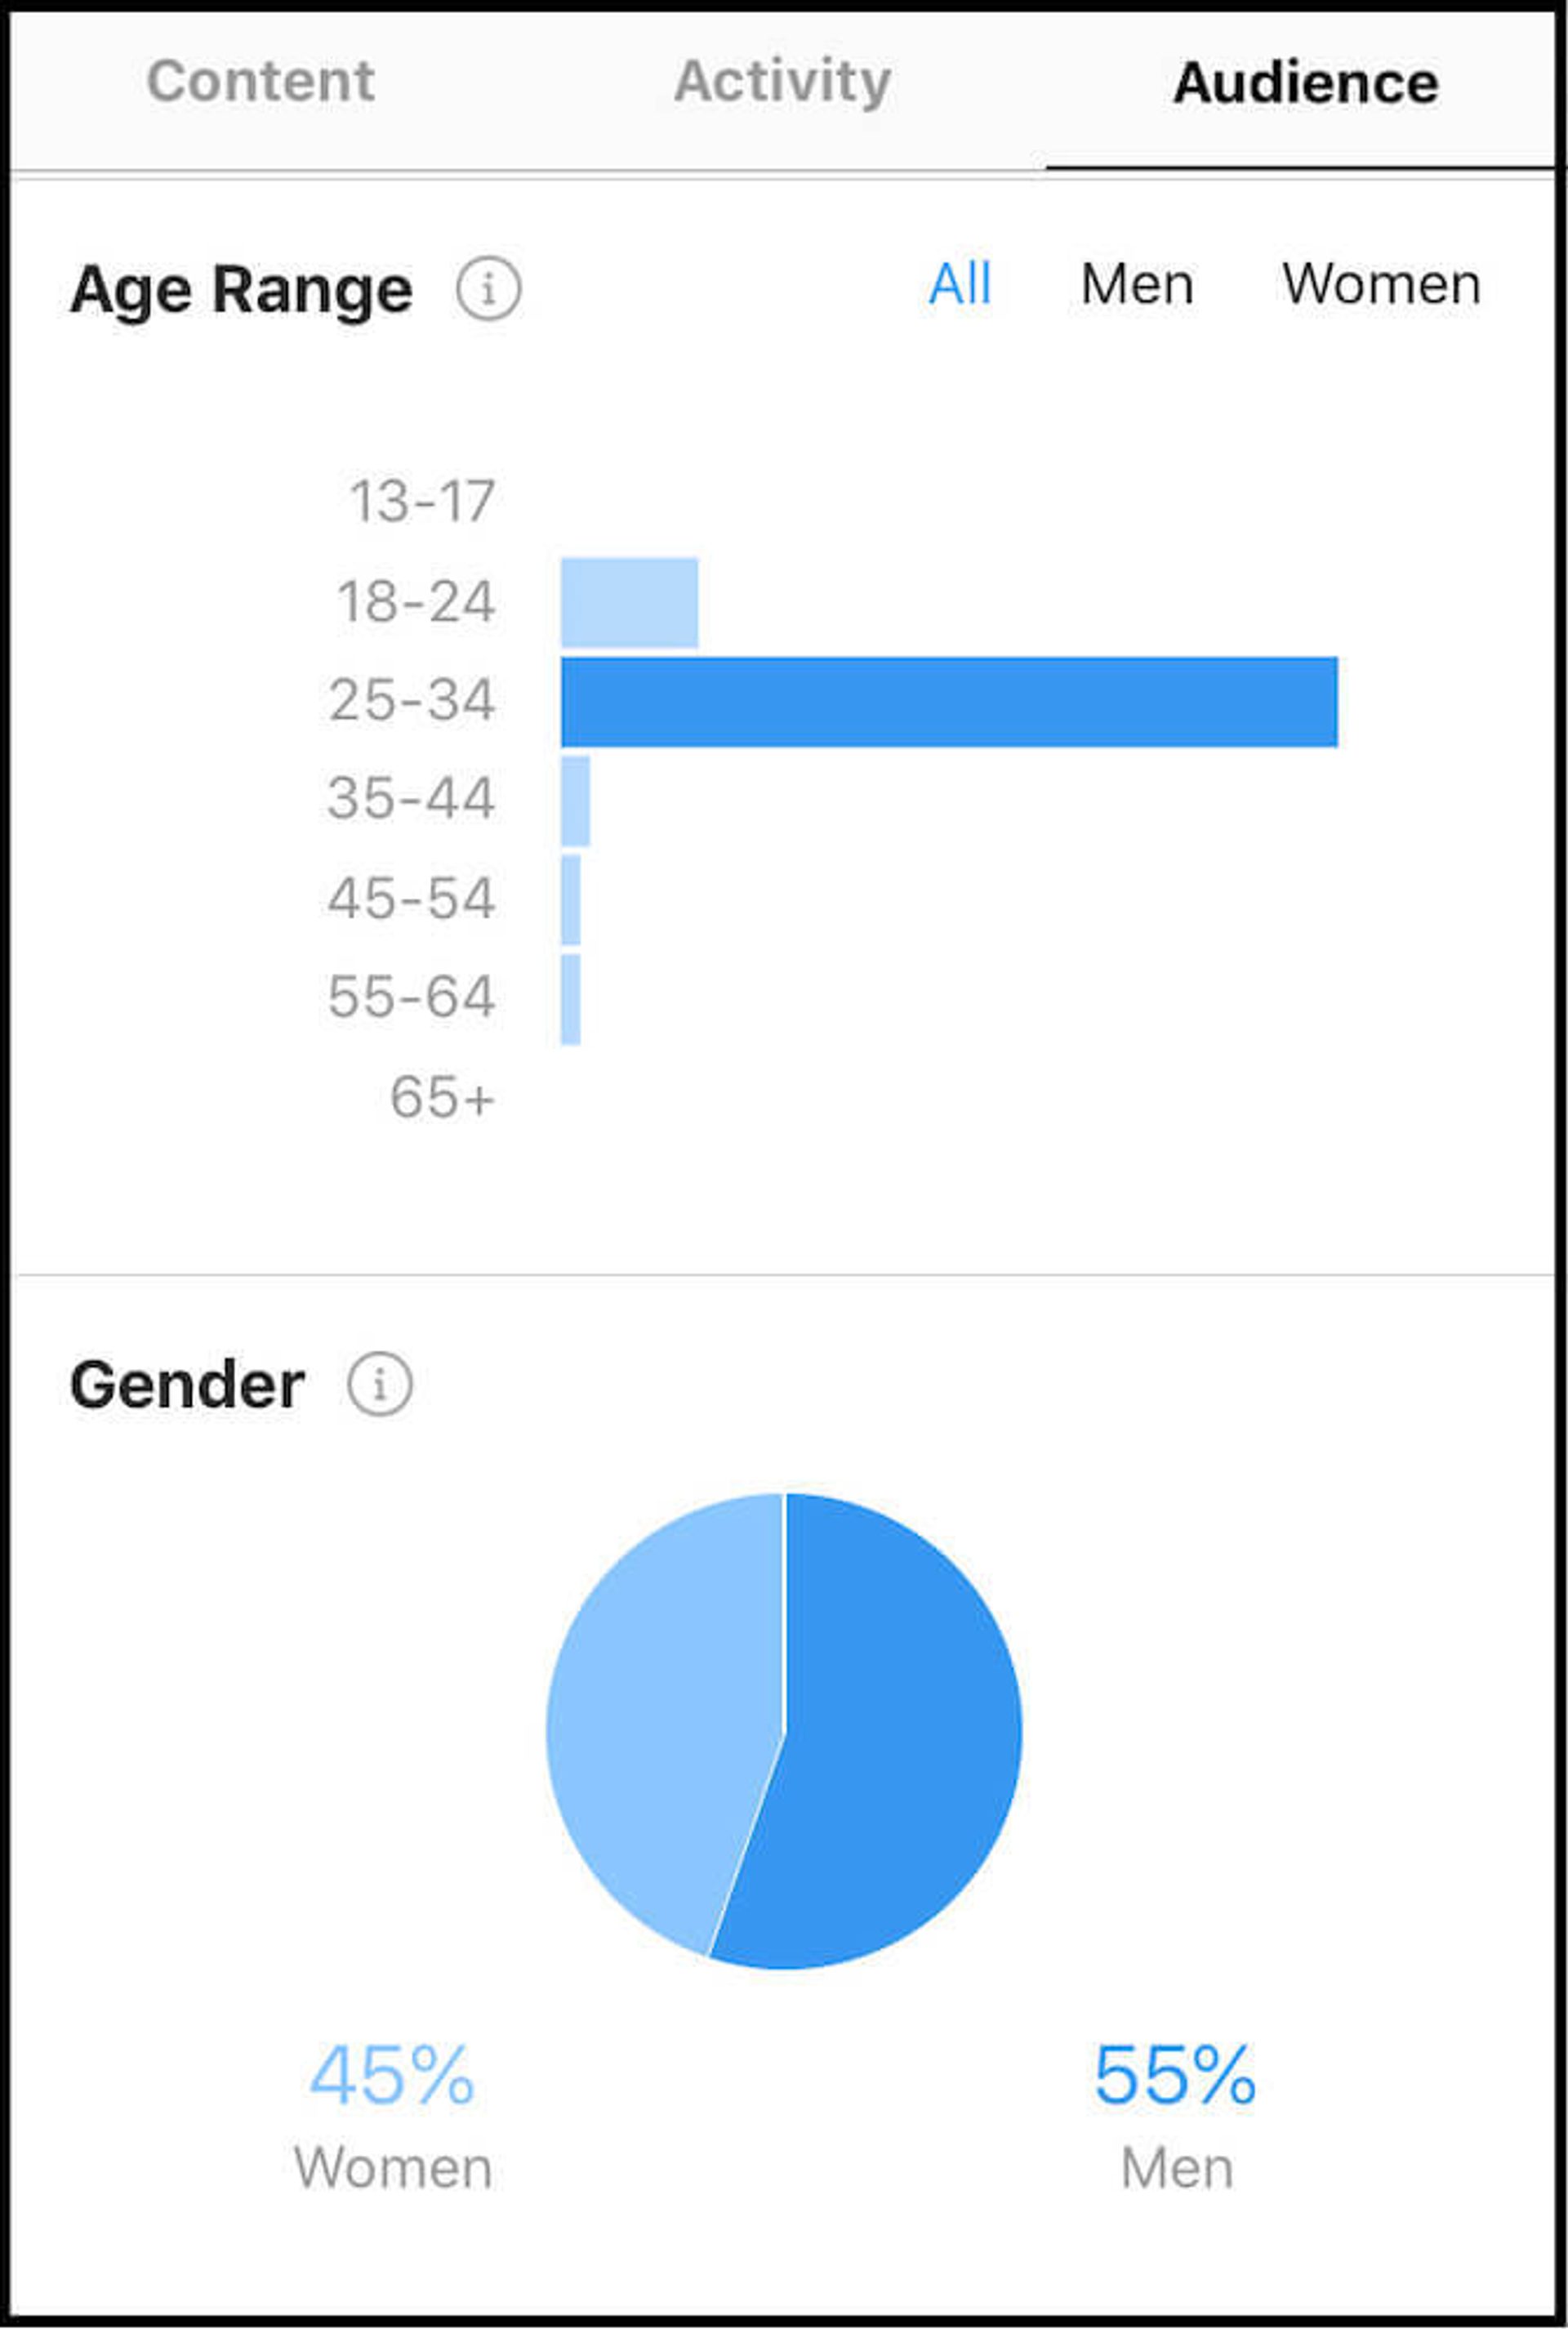
Instagram gives you demographic information to see who your audience is, and helps in refining your target audience
Where do you find this information?
Social media information is available from each platform in the insights or analytics tabs in your home marketing dashboard.
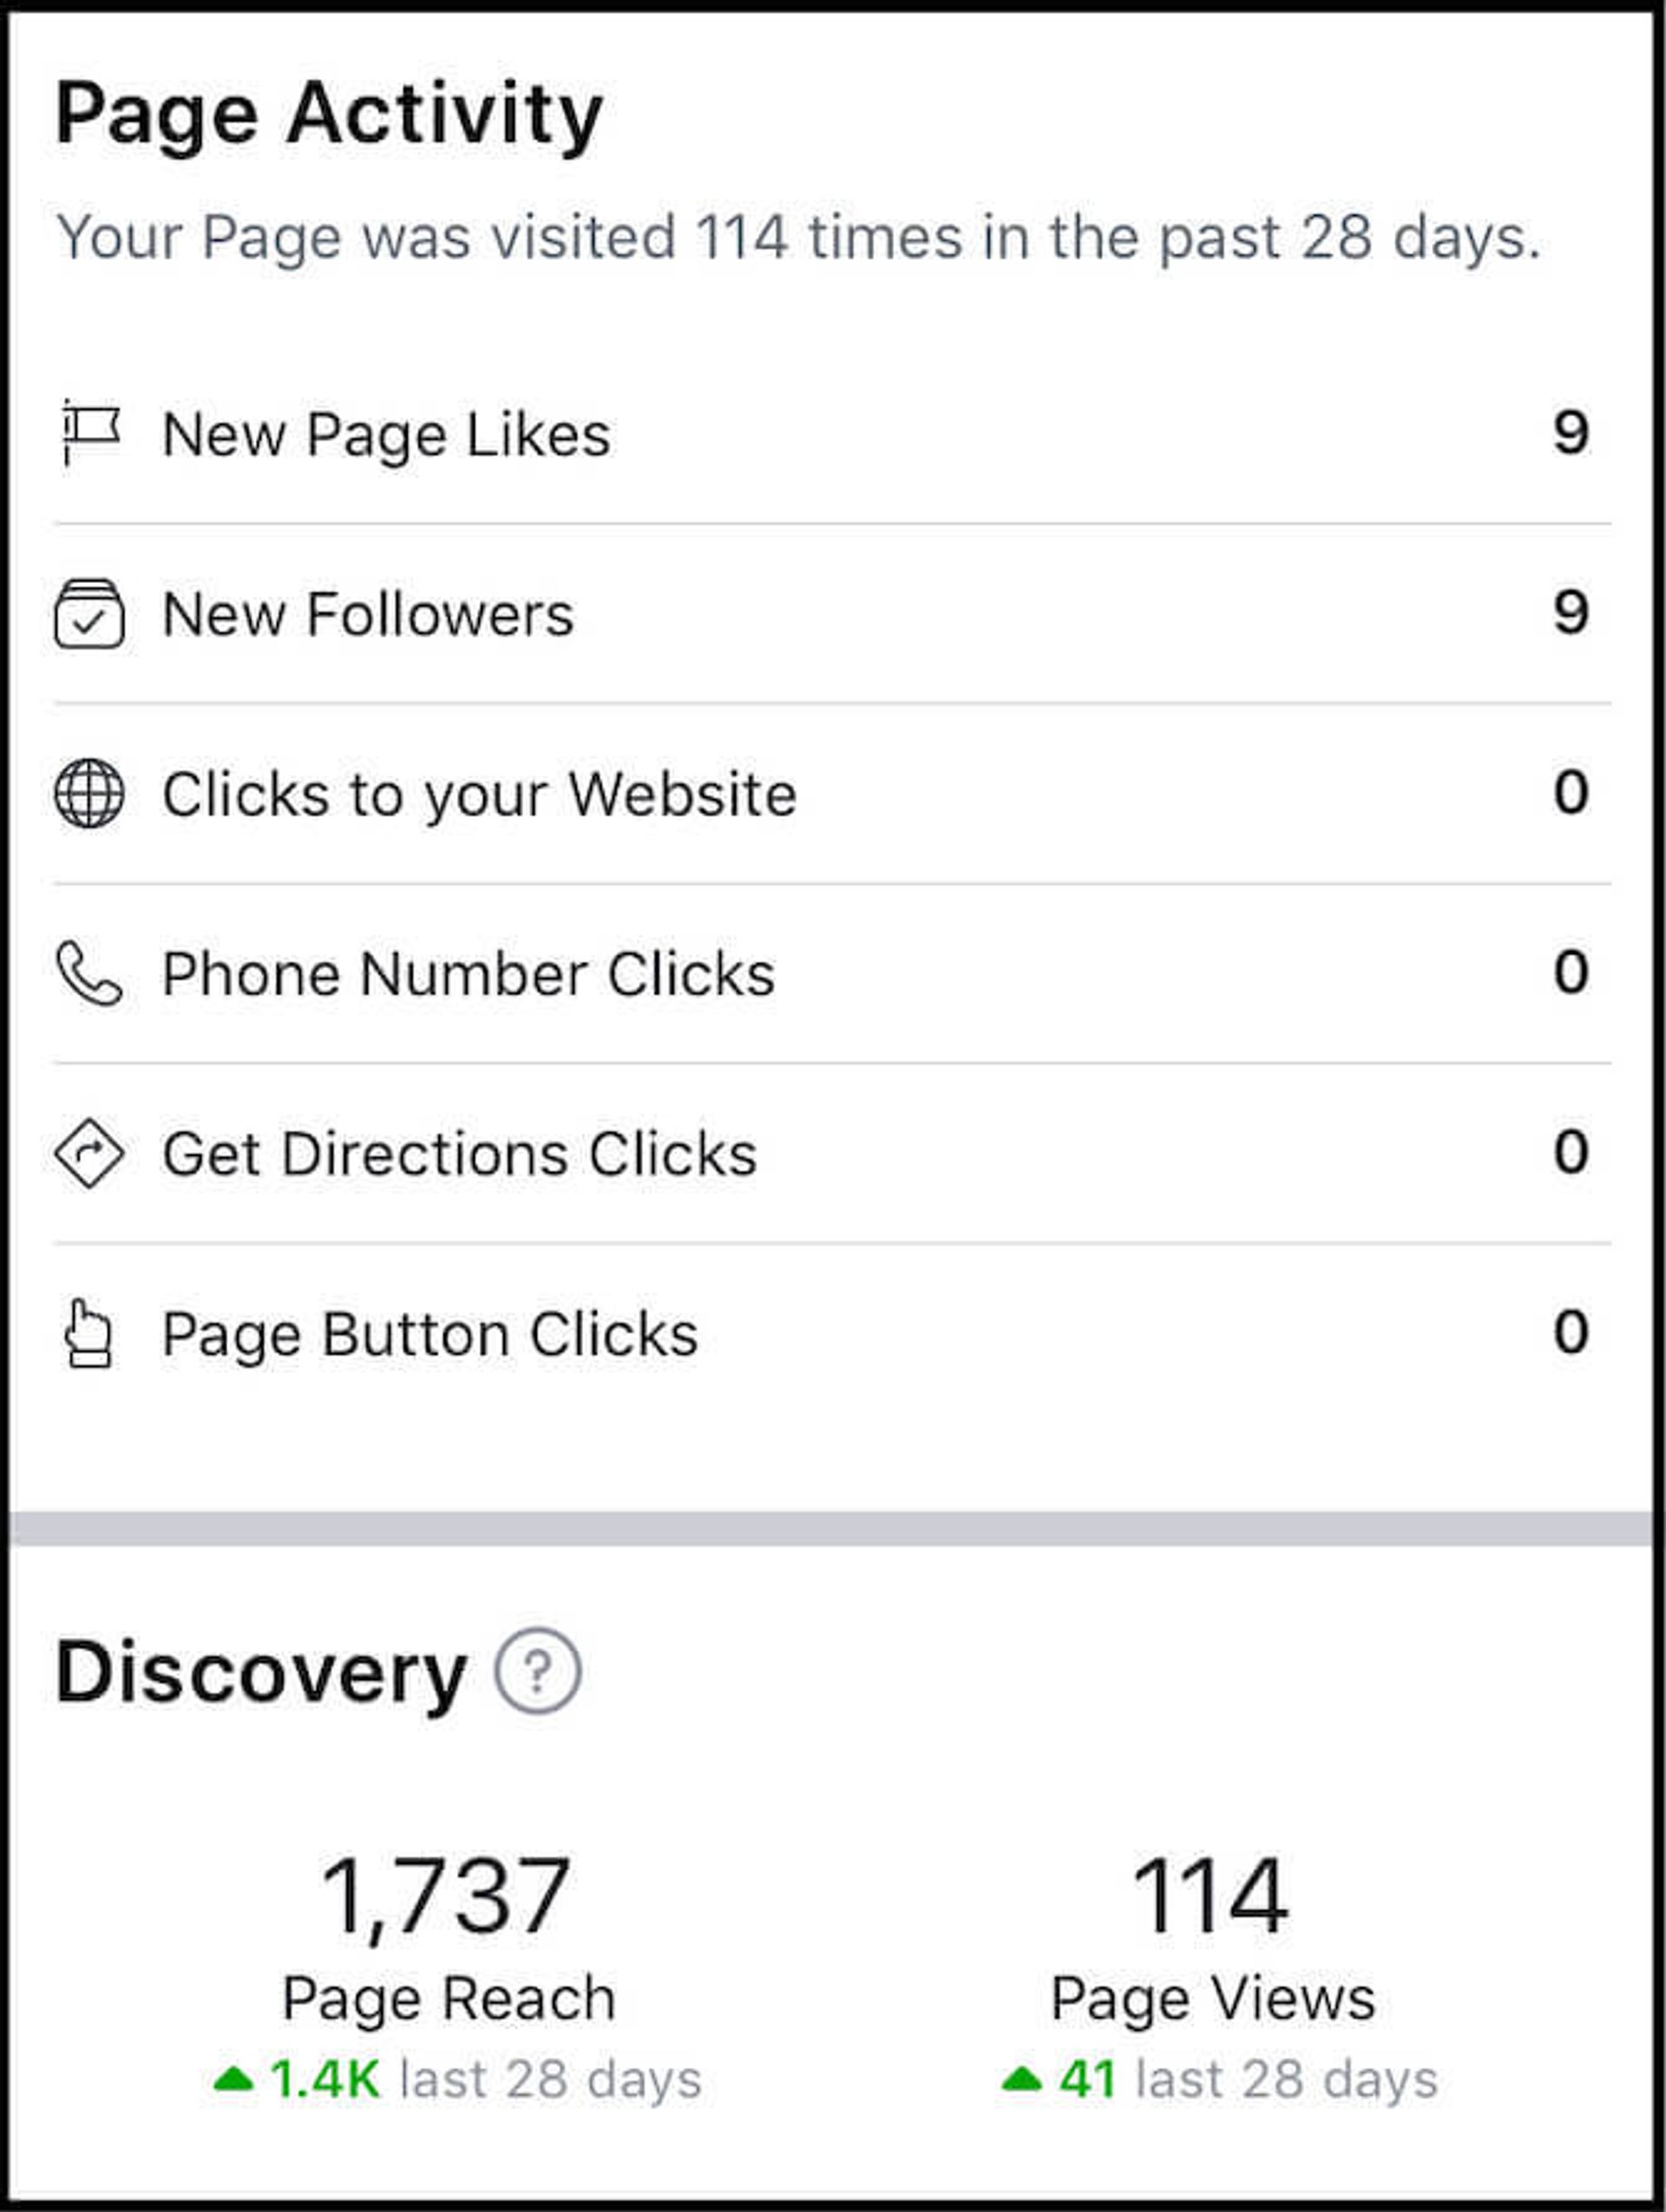
Facebook provides a breakdown of your business page and how it’s performing with several metrics
4 things to remove from your marketing report
- Jargon
- Metrics not tied to core values or goals
- Visuals that don’t add context
- Irrelevant data
1. Jargon works when two experts are talking and both know all the terms, acronyms, and subtleties. But most of the time it confuses people.
Merriam-Webster defines jargon as “obscure and often pretentious language marked by circumlocutions and long words” or “confused, unintelligible language”.
Don’t confuse your audience. Remove jargon from your marketing report.
2. Metrics not tied to core values or goals have no place in the report, either. They muddy the waters and take away from the numbers and figures that matter. Your audience can only hold so much in the brain at once.
Don’t take up valuable real estate with numbers that don’t mean much of anything.
- Every search engine ranking for every post
- Search engine ranking changes for keywords
- Website bounce rate
- CAC of a certain channel that isn’t designed to add customers (podcasts, welcome emails)
We’ve covered a lot of metrics in this post, and you don’t need to include all of them. Choose the metrics that make sense for your business. What metrics tie back to customers for you?
3. Visuals without context actually remove context from the audience.
Graphs, charts, and other visuals are more memorable that simple text. They’re a great way for your audience to remember information. But if you toss them in without explanation they do more harm than good.
Visuals are valuable tools, but can also confuse your audience. We’ve all seen a line graph with 100 different lines on it. That doesn’t help anyone understand anything (except maybe the 14 variations of blue).
They will remember the graph but not the reason why or the information it presented. If you plan to use a visual, give it the appropriate context and make sure it applies to your goals and objectives.
4. Irrelevant data frustrates your audience and lowers the quality of your marketing report. Good reports tell a story and give clarity. Irrelevant data makes the report harder to understand.
Keep your purpose in mind and choose the data that tells the story and keeps it simple.
How often should you create a marketing report?
For the most part, a monthly marketing report is the best indicator of your marketing department’s performance. Monthly reports use a solid data set and show how you’re pacing towards your goals.
The different frequencies of reporting give you different advantages.
Weekly marketing reports are good for individual teams within the larger marketing department.
- Team reports and updates are more granular than a general marketing report. They get further into the details, and not everyone has to see them.
- Weekly updates make teams aware of goal pacing.
Question: Should you do daily reports?
Mostly likely, no. Reporting on a daily basis is almost impossible to take action on. Daily monitoring of some marketing activities (like a PPC advertising campaign) is valuable, but completing a daily marketing report on your daily activities often causes more confusion than clarity.
To save yourself time: Make a repeatable process for your marketing reports
Nobody wants to spend hours writing a digital marketing report every week, month, or quarter. And you don’t have to. Alternatively, you could save time by setting up a marketing dashboard tool to track your KPIs. You can put together a dashboard for your team that automatically updates.

The process becomes repeatable once you know what you want to get out of it.
Follow these steps and you’ll have a repeatable process for how to write a marketing report:
- Determine the purpose of the report
- Ask what you want to learn from it
- Define your marketing goals
- Identify the information that will tell you what you want to know
- Assemble the marketing data in an order that tells the story
- Use the order as a marketing report outline for future reports
- Iterate and repeat
- Make changes to the marketing report template as needed
Who gets a marketing report?
Beyond the marketing department, who else benefits from this information?
Two groups, in particular, will benefit from the information in the marketing report.
- Sales
- Executives & CMOs
1. Sales – Marketing data is valuable information from the top of the funnel. Marketing efforts bring in prospects and leads. Eventually some of those turn into SQLs for the sales team.
Sales benefits from the marketing report data in a few ways:
- Knowledge of how many leads come in
- Awareness of trends in lead flow as they happen
- Knowledge of what to expect and prepare for changes
- Recognize which messages, features, or products are generating the most interest
In a perfect world, the sales department takes the marketing report data and changes their pitch to match the marketing message that brings in leads. They’ll use marketing assets in outreach and conversations with prospective clients.
Aligning marketing and sales has huge benefits to your business.
- 32% higher revenue
- 36% increase in customer retention
- 38% higher sales win rates
2. Executives – key stakeholders learn where the business is headed from the marketing report. It’s a snapshot of the business. They can see the numbers of leads and customers that are coming in and evaluate the performance.
Executives don’t care about clicks, blog reads, or CPA numbers as much as the marketing department. If they’re involved in the marketing report presentation, it’s important to get as close to the $$$ numbers as possible.
6 things to include in your marketing report
A marketing report works best when you have a defined purpose before you start. Keep it simple, keep it straightforward, and tell the story.
These 6 items help you create an effective marketing report:
- Goals
- Website analytics
- Email marketing data
- Leads and customers
- Explanations of the numbers
- Social media data
Take the next step: Build better marketing reports
Ready to simplify your reporting process and gather deeper insights?
ActiveCampaign’s analytics tools let you track performance across email, automation, and more—all in one place.
Whether you’re fine-tuning existing campaigns or starting from scratch, our platform can help you make data-driven decisions faster.
Get in touch to see how ActiveCampaign can transform your marketing reports—and results.
Marketing report FAQs
Whether you’re just getting started or fine-tuning your strategy, here are answers to common questions about creating and using marketing reports.
What are the best analytics tools for generating detailed marketing reports?
Tools like Google Analytics (for web traffic data), ActiveCampaign (for email performance and lead tracking), and social media platform analytics (Facebook, Instagram, Twitter) are popular starting points.
Many businesses also use dedicated dashboards (like Tableau or Google Data Studio) to compile and visualize data from multiple sources.
What are the different types of marketing reports?
Common types include channel-specific reports (email, social media, SEO), campaign-focused reports (tracking the success of a specific promotion), and broader, executive-level overviews that cover KPIs across multiple channels.
Your choice depends on the goals and audience of each report.
How do you share marketing report findings with executives?
Focus on the metrics that tie most closely to revenue or strategic goals—like number of leads, conversion rates, or ROI. Provide clear visuals and concise summaries that make it easy to understand outcomes and next steps.
Executives don’t usually need every data point—just the key insights and implications.
What are the use cases behind marketing reports?
Marketing reports can justify budget decisions, highlight top-performing channels, reveal areas for improvement, and align teams around common goals. They also serve as communication tools for stakeholders—showing clear ROI, guiding strategic pivots, and supporting data-driven decision-making.