CRM dashboards provide a centralized view of your business's data, sales, and key performance indicators. Your customer relationship management (CRM) solution contains a wealth of essential data on your customers, leads, in-progress deals, marketing campaigns, and more.
But it's not enough just to store that information.
You need to be able to access it quickly and use it to make better decisions.
That's where CRM dashboards come in.
CRM dashboards give you insights into your customers, sales, marketing activities, and progress toward goals.
This article introduces CRM dashboards, explains why you need them, and shows you how to create dashboards that benefit your business.
What is a CRM dashboard?
CRM dashboards give you quick access to real-time information about your sales activities and performance. Dashboards are a feature of most modern CRM systems. The best ones offer a wide variety of easy-to-understand graphs and charts.
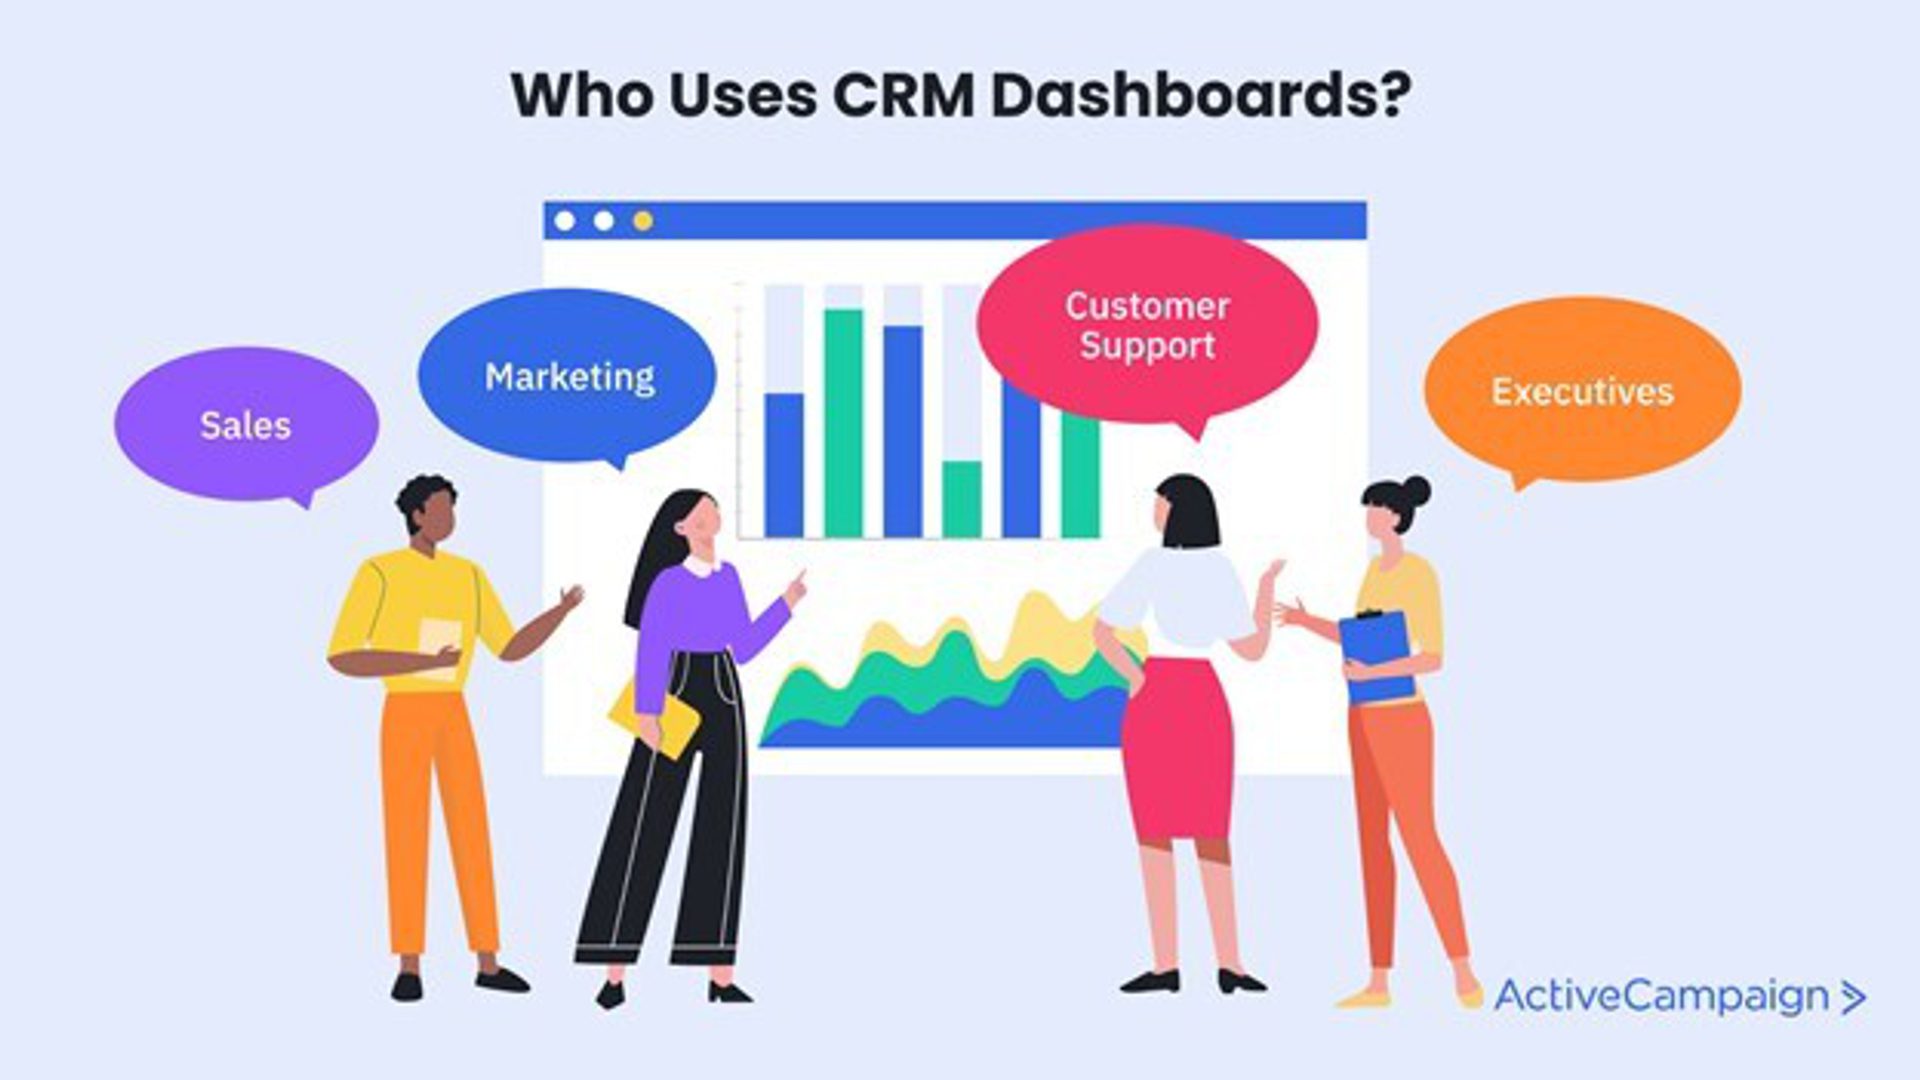
Who uses CRM dashboards?
Team members across the company can benefit from intuitive visualizations of key data. Some dashboards, like task lists, are made for individuals. Others, like campaign performance reports, are shared by whole teams.
The groups that find the most value in CRM dashboards include sales, marketing, support, and the C-suite.
Sales
CRM dashboards help the sales team monitor their pipeline and prioritize the most important deals and opportunities. Dashboards can be used to display deal statuses, sales forecasts, individual sales rep performance, and more.
Marketing
Marketing CRM dashboards track key metrics from the size of your contact list to the performance of your most recent marketing emails.
Customer support
Customer support can use dashboards to get insight into the ticketing workflow, including the average ticket response time and how many tickets are currently in the pipeline.
The customer support team can also view marketing campaign dashboards to get a sense of what makes customers happy in order to improve customer experience.
Executives
Business leaders don’t want to deep dive into every deal or marketing campaign — they want to quickly understand what’s going well and what needs fixing. They want sales forecasts, revenue projections, and other big-picture reports.
Dashboards are the perfect tool to give executives a broad overview of the organization’s performance.
Benefits of CRM dashboards
When businesses choose to invest in a CRM, they’re usually thinking about automating mundane tasks or managing contacts and leads.
CRM dashboards and reports are just a bonus.
But dashboards have the potential to transform your processes, decision-making, and communication. Let’s look at a few of the key benefits.
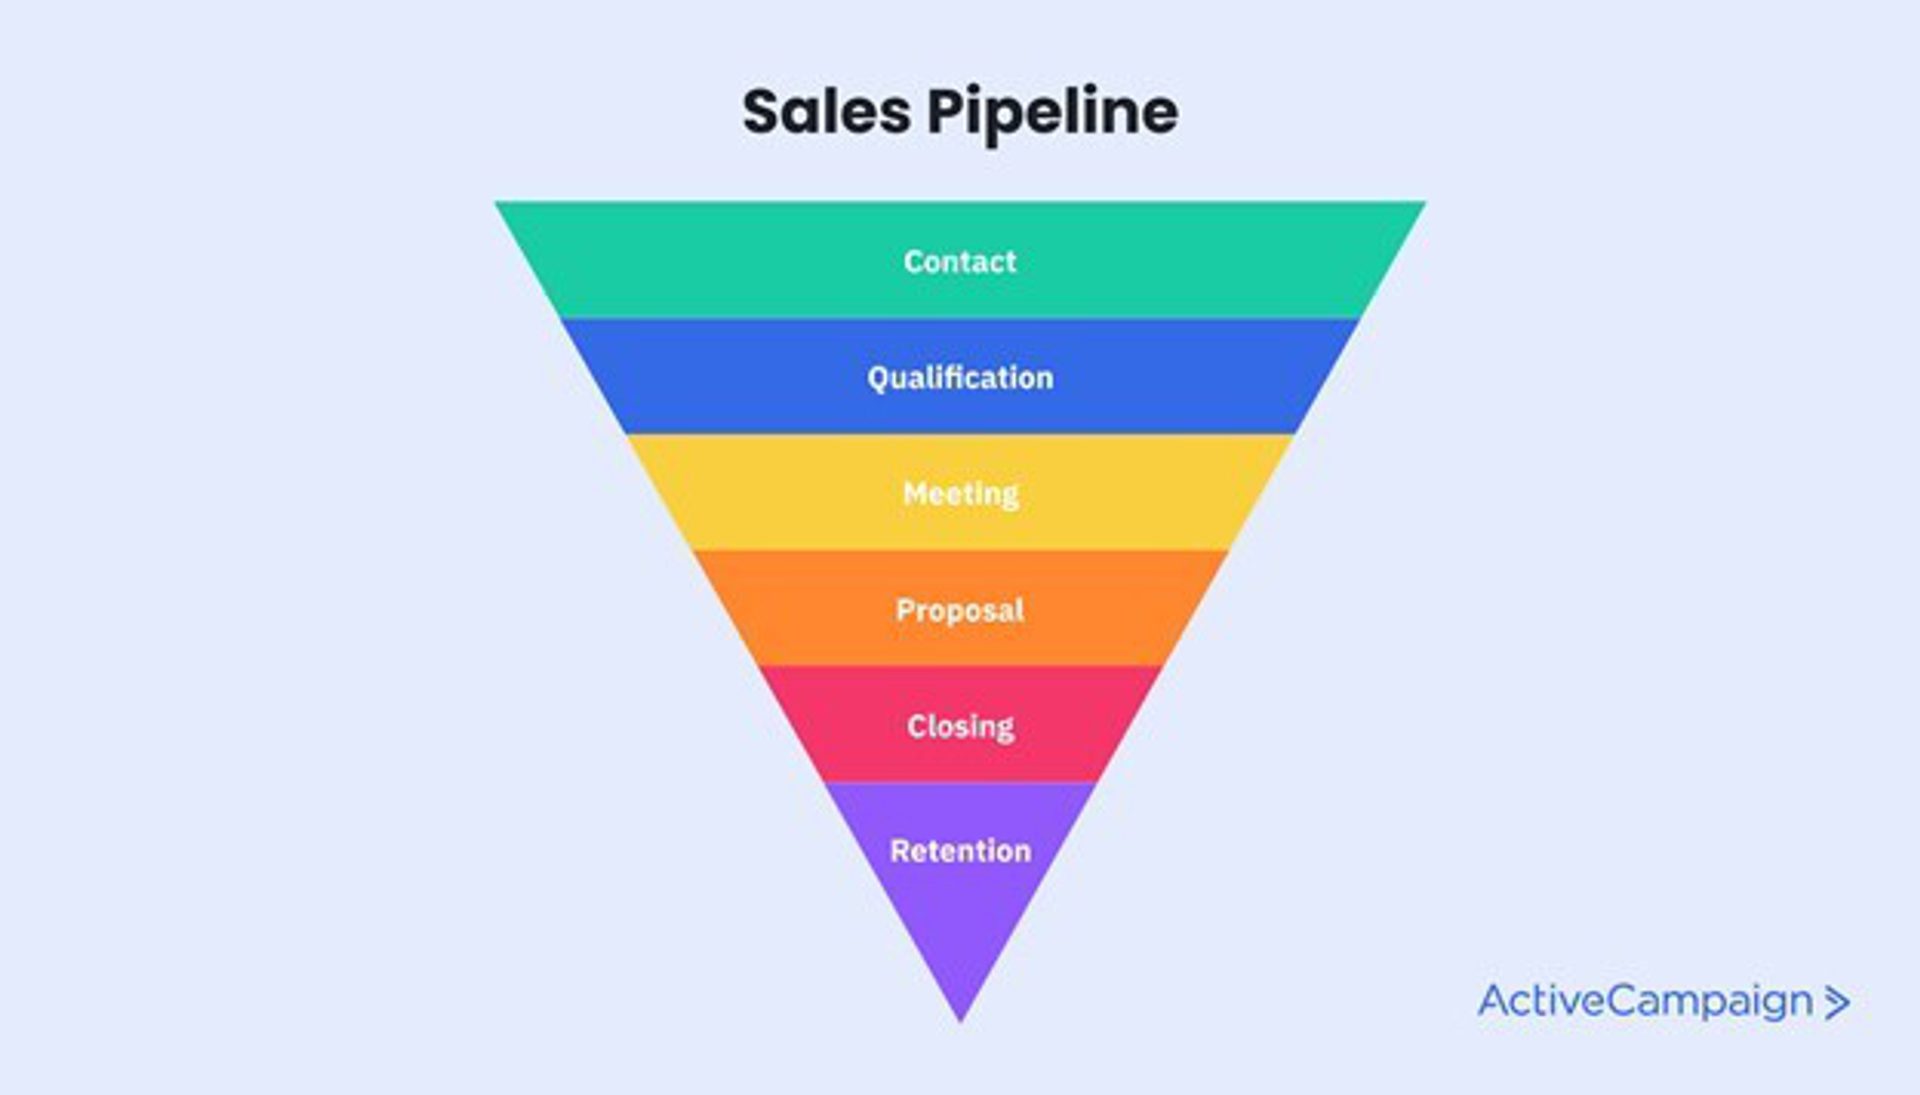
1. Insight into your sales pipeline
CRM dashboards offer a broad view of the entire sales pipeline. For example, you can see how many deals are in each stage of the pipeline and what the average value of those deals is. Or look at deals by sales rep or by industry.
Having a centralized hub for pipeline data helps salespeople prioritize leads and focus on the deals they can close.
2. Real-time updates
Unlike those spreadsheets you share at the monthly meeting, CRM dashboards update in real-time. Having access to the latest information helps you take action quickly and make better strategic decisions.
3. Simplified information sharing
Dashboards allow every stakeholder to access the same up-to-date information.
Nothing gets lost in email. No one has last week’s version of the data. Everyone can see the same dashboard from any device in any location.
A great thing about dashboards is that they keep teams on the same page. For example, when marketing and sales share dashboards, it improves the flow of the pipeline.
Say you have a dashboard widget showing deal status by industry — marketing can identify which industries are providing high-quality leads and focus their lead-generation efforts there.
Features of a good CRM dashboard
Dashboards are a component of most CRMs, but some are better than others. Here are some features you should look for in CRM dashboards.
Customization
Your teams should be able to see the information that’s valuable and actionable to them — nothing more and nothing less.
Customizable CRM dashboards let you access real-time data that reflects your business, your processes, and your pipeline. You can focus on your top goals and never waste time digging through data that isn’t relevant to your organization.
Intuitive interface
Your CRM will be used by team members from a variety of departments with a wide range of experience — accessing and interpreting CRM dashboards shouldn’t require any expertise. Any user should be able to easily find, understand, and export data from the dashboards.
User permissions
A good CRM will let you grant different levels of access to users in different roles. Some people may only need permission to view a dashboard, while others should be allowed to edit it.
How to create CRM dashboards
For sophisticated dashboards that streamline reporting and aid decision-making, just follow these steps.
Step 1. Choose the right CRM
It all starts with the right CRM software.
Before you evaluate solutions, have an idea of which metrics will be most important to your CRM reporting. That way, you can confirm that the CRM can generate the dashboards you need.
Of course, dashboards aren’t the only functionality to look for in a sales CRM. Look to combine your intuitive visual displays with features like:
- Automated workflows
- Contact management
- Contact and lead scoring
- Customizable pipelines
- Sales forecasts and win probability predictions
- Integrations with your existing tech stack
Step 2. Define your goals
The best CRM dashboards can display reports on almost any metric. But there’s such a thing as too much data.
Your dashboards are supposed to be a quick snapshot of important information, not a messy jumble of graphs and charts that team members have to waste time digging through.
Narrow down the goals of each team to a few key metrics. You can always change this later (see step five), but it’s best to start with the most meaningful reports and go from there.
Step 3. Consider your sales process
Every business has a unique sales pipeline and process. Your customized dashboards should reflect yours.
For example, if you sell to multiple personas with distinct customer journeys, you might want separate dashboard displays for each one. Or you might want to break down your sales performance by the product groupings you use at your company.
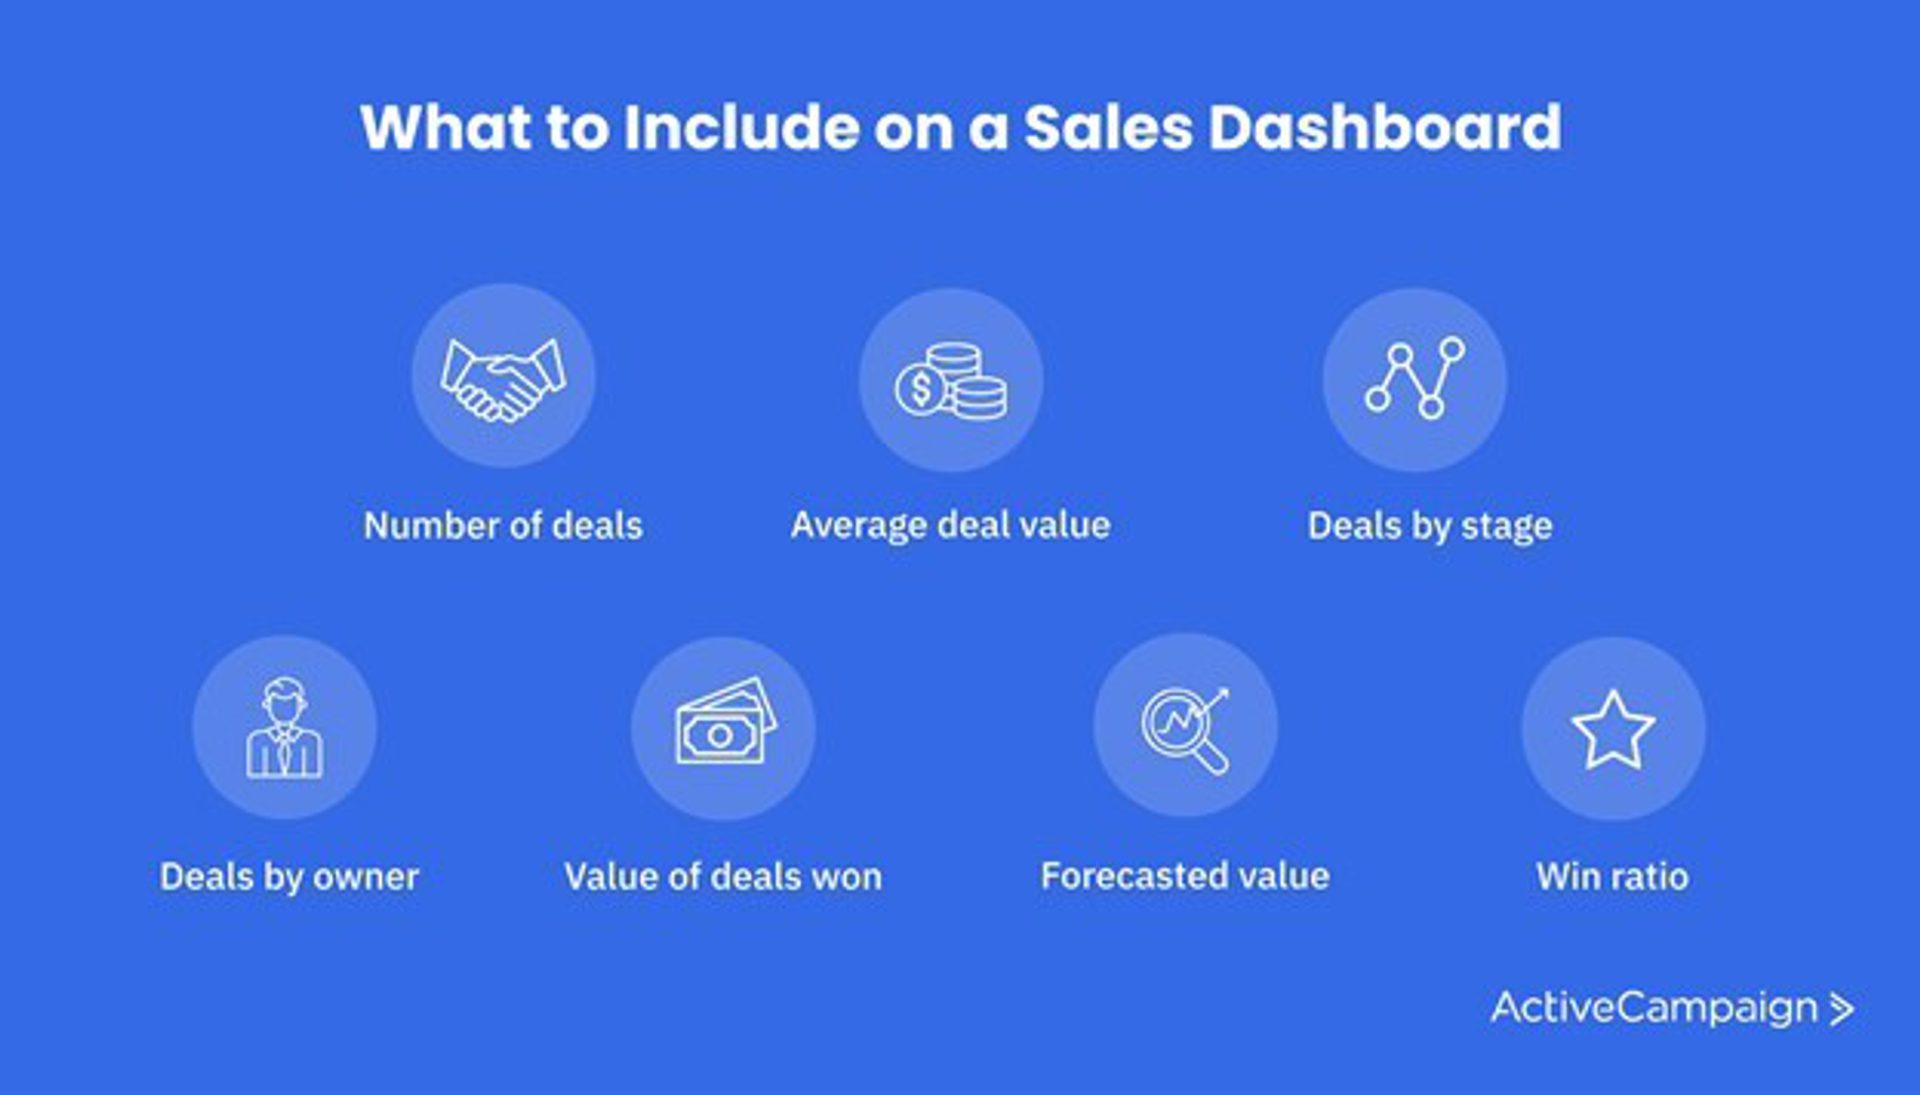
Step 4. Build your CRM dashboard
In steps two and three you gathered information about your KPIs and your unique sales process. You should now have a clear idea about what to include on your CRM dashboard.
Some CRMs offer templates to simplify the process of creating your dashboards. See if any pre-created dashboards meet your needs as they are or with minimal edits.
Your dashboard creation options will depend on your CRM, but you’ll probably have to make some decisions about how your data will be displayed.
If you’re displaying the number of new deals, will you show the daily, weekly, or monthly value? Will your sales rep performance dashboard be a table or bar graph?
If you’re using ActiveCampaign, follow these instructions to create custom CRM dashboards.
Step 5. Stay up-to-date
Your sales and marketing goals change regularly, and so should your CRM dashboards. Determine how often you’re going to review the dashboards.
When you do your review, talk to members of each team that uses the CRM. Find out if there’s any information they need to do their jobs better. And ask if they find the current information useful — don’t leave useless widgets on the dashboard.
Are any team members still compiling data manually? CRM reporting could streamline the process.
CRM dashboard examples
Looking for some CRM dashboard inspiration? These are a few of the real dashboard reports that ActiveCampaign offers.
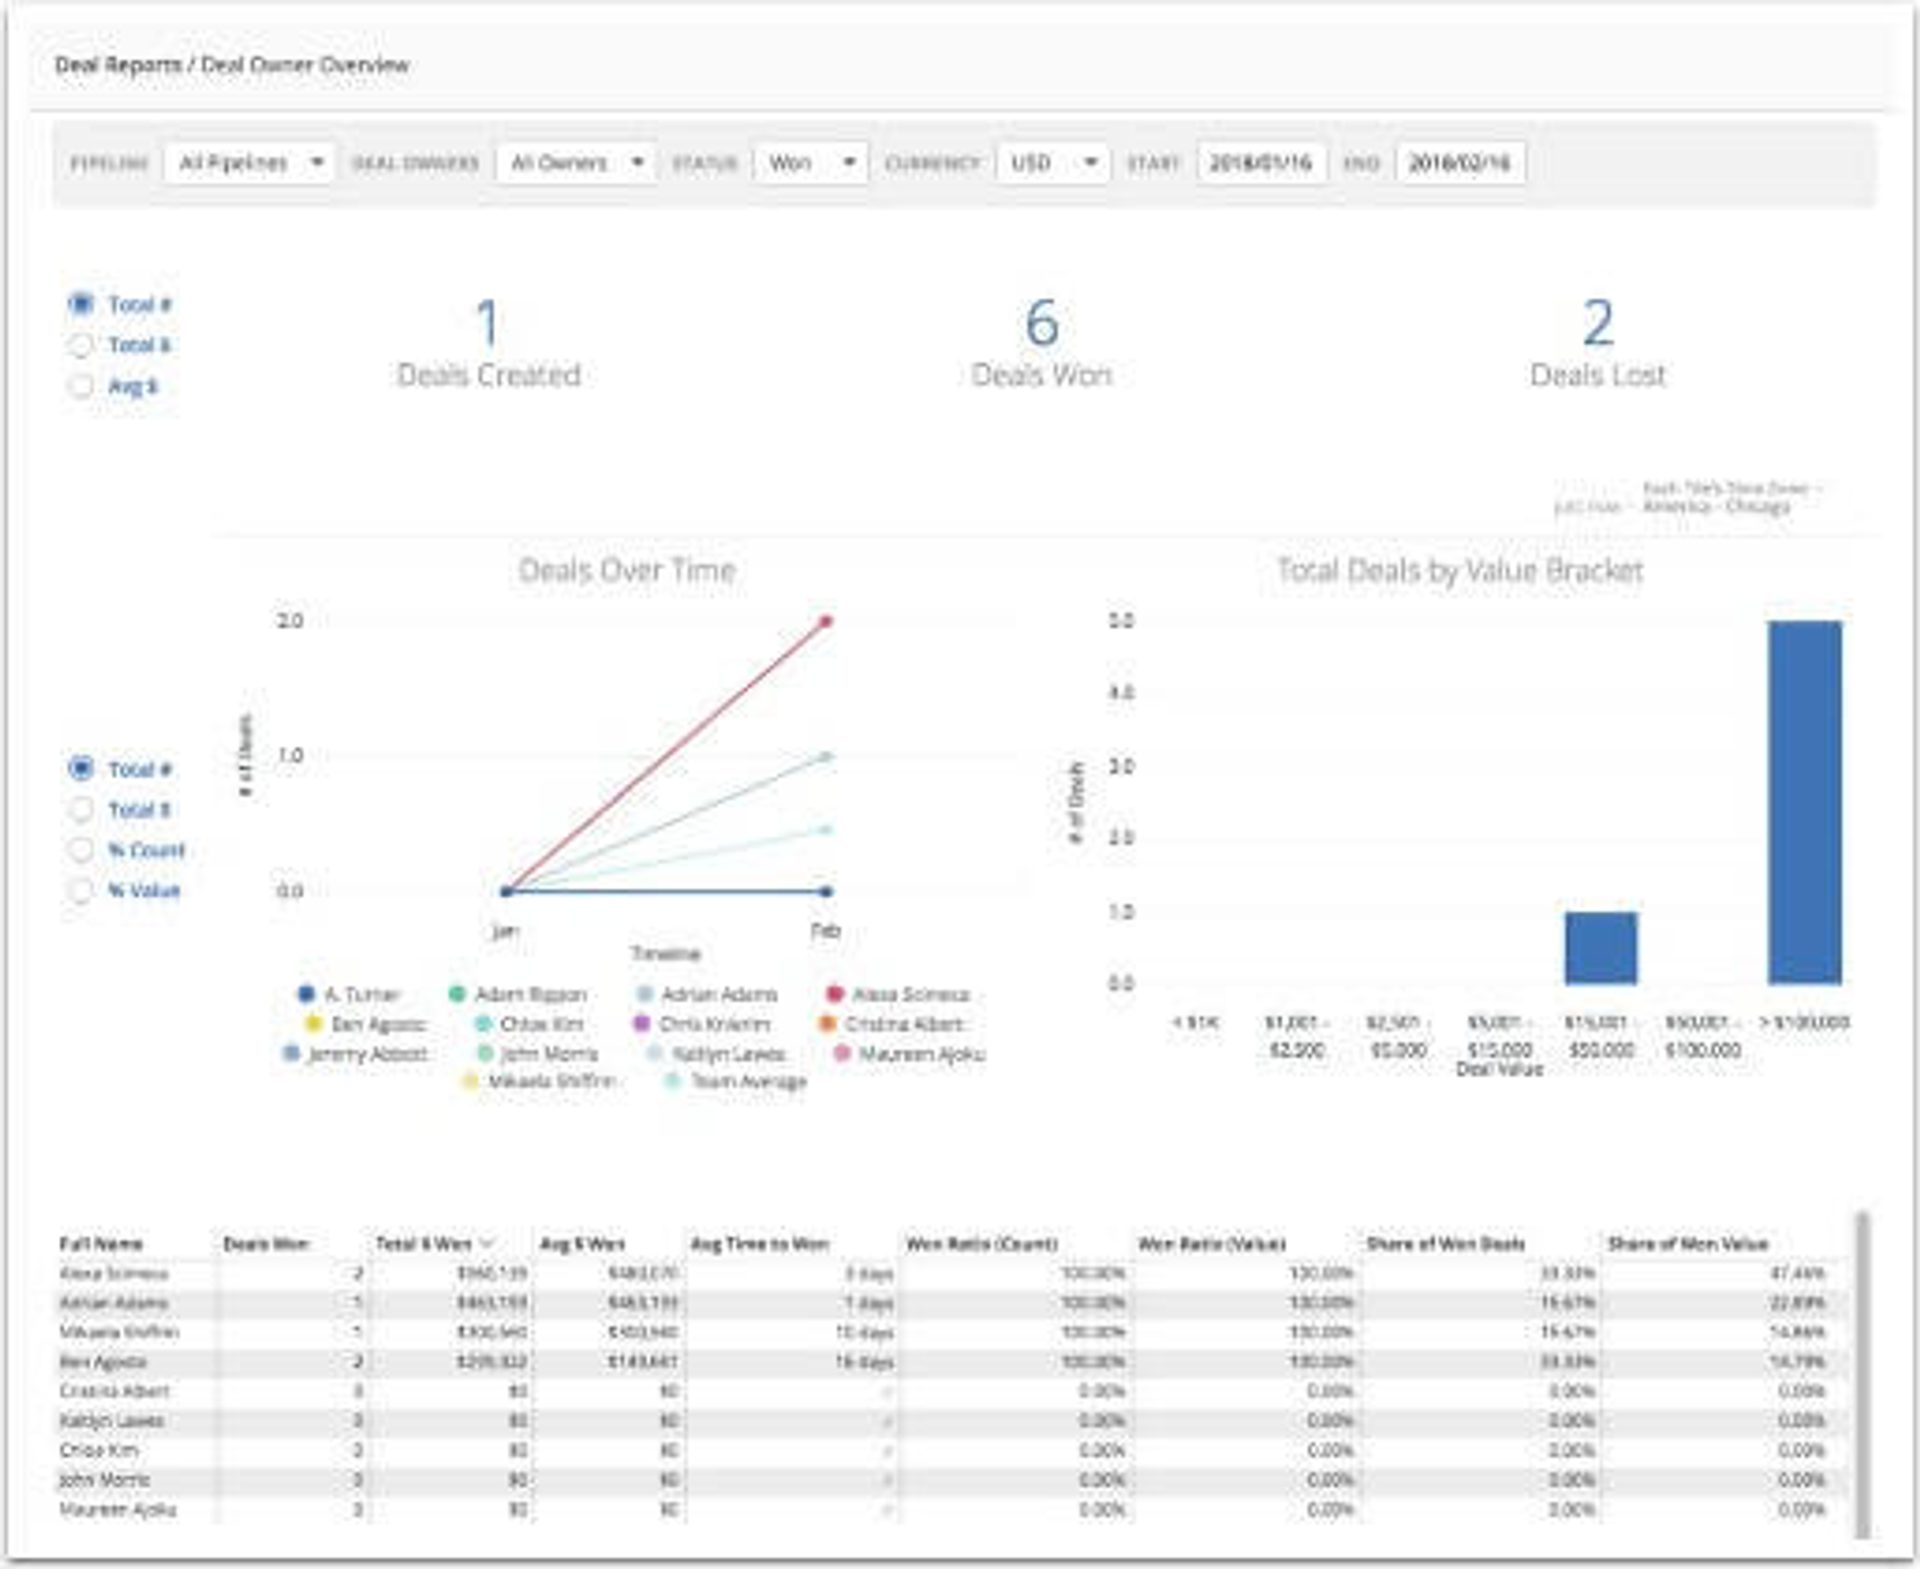
Deal Owner Overview report
The Deal Owner Overview report lets you view the performance of your sales team over time. By default, this dashboard shows the total number of deals that were created, won and lost across all pipelines. You can also apply filters to see specific pipelines, deal statuses, and more.
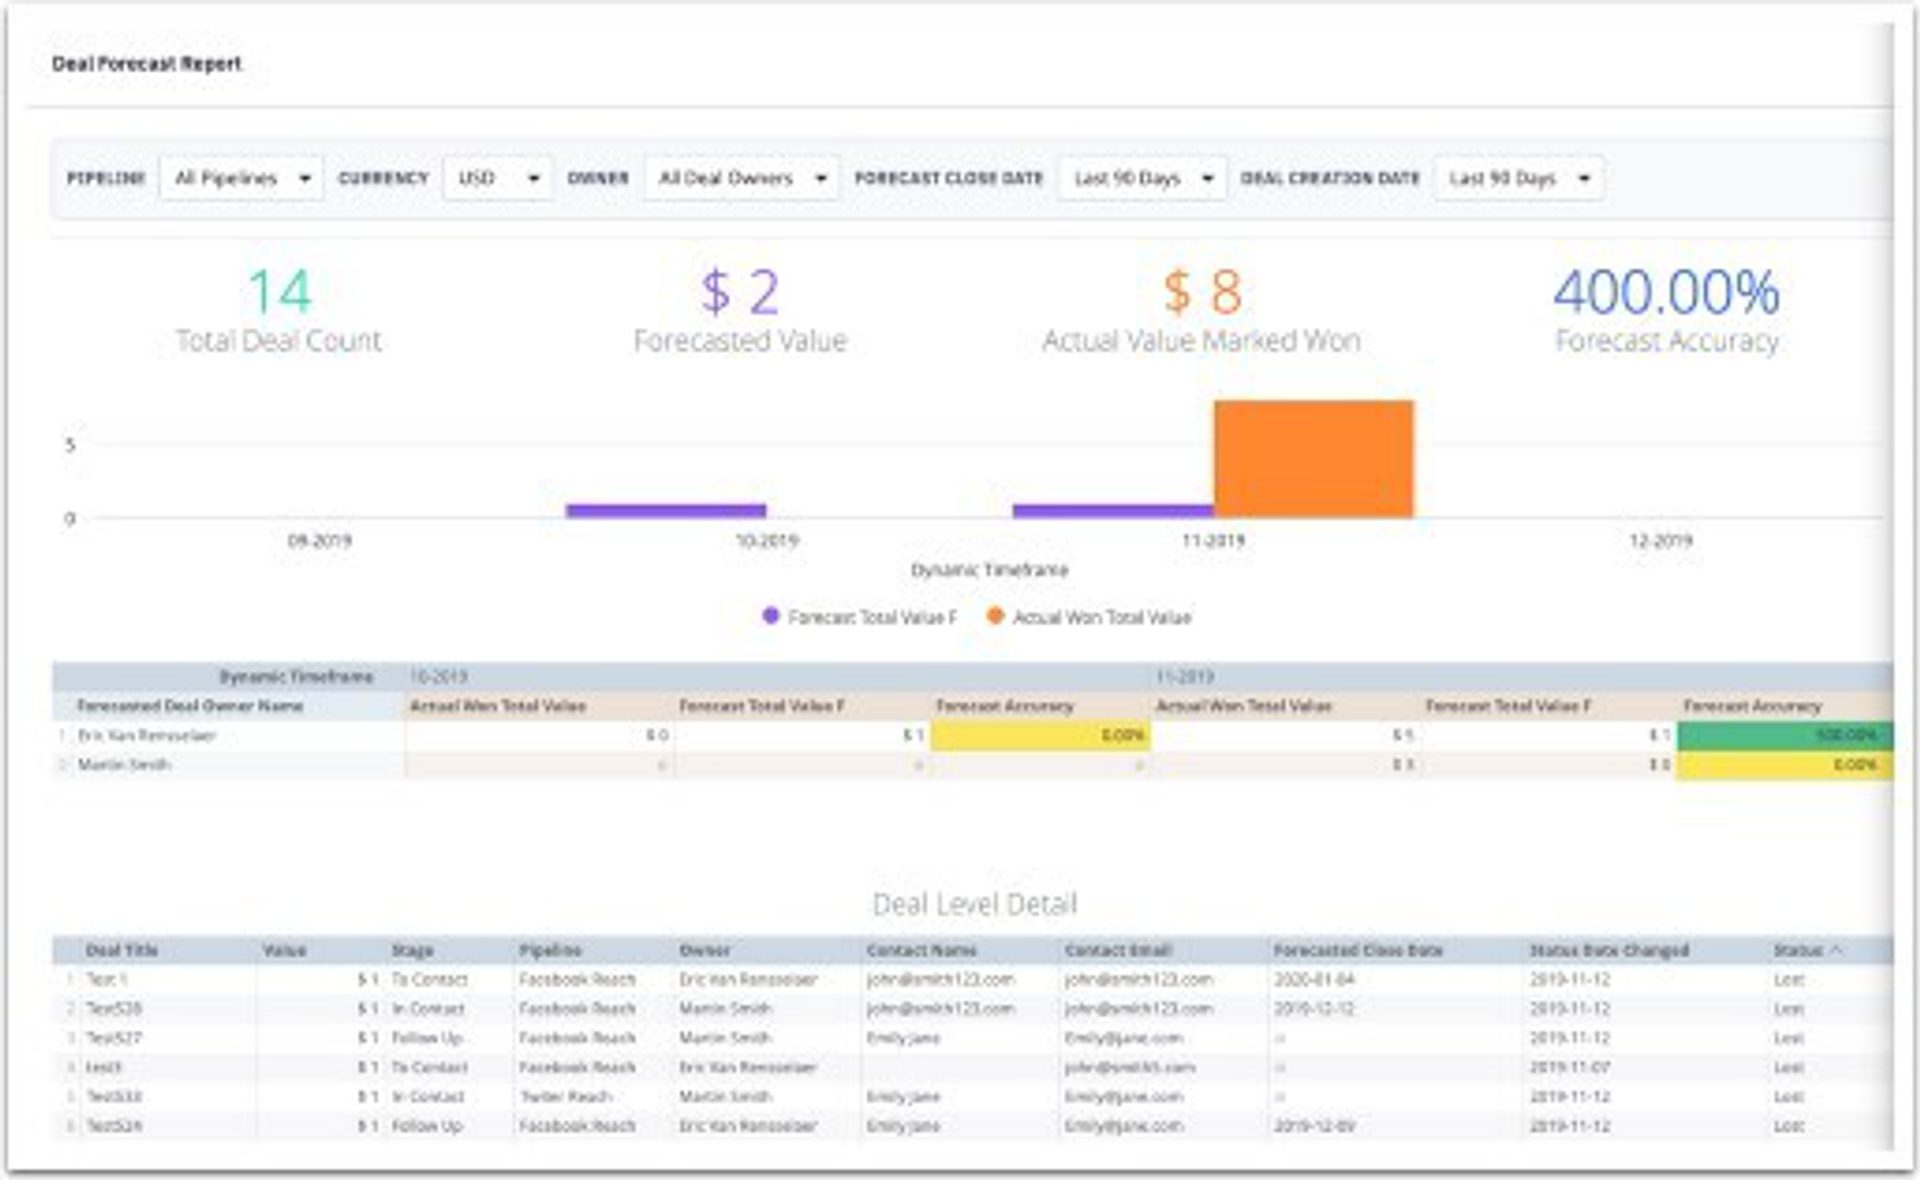
Deal Forecast report
The Deal Forecast report shows you your pipeline status and provides business forecasts on a daily, weekly, or monthly cycle. It also lets you see your historical forecast accuracy.
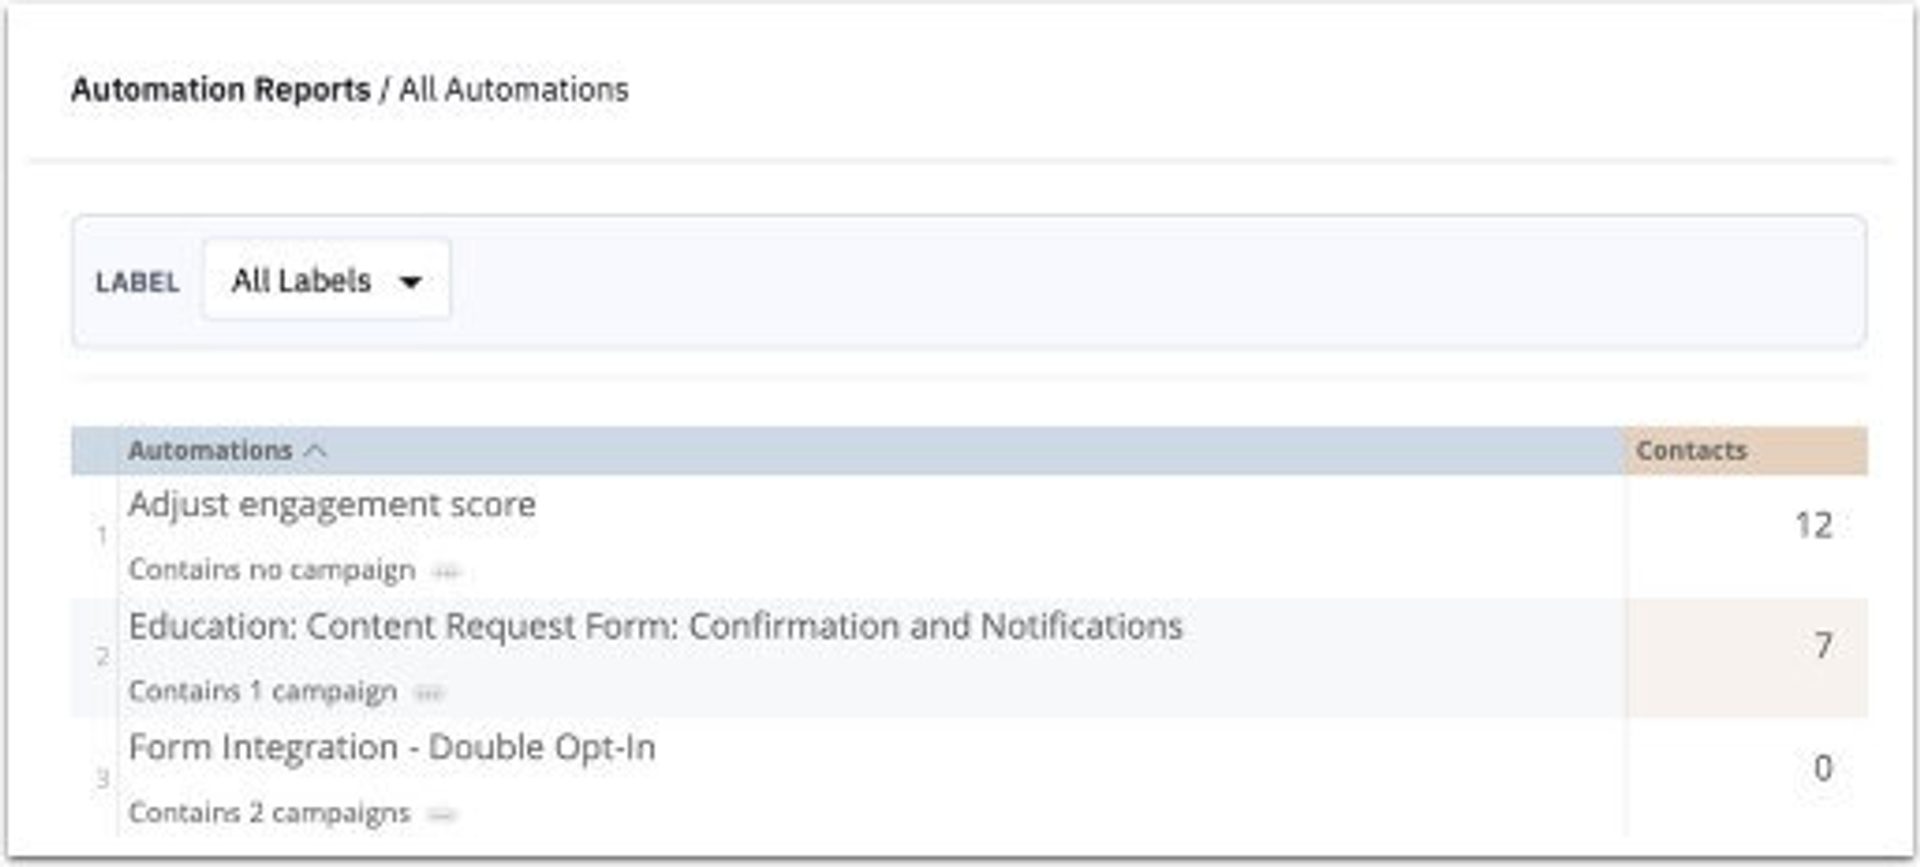
Automation Overview report
The Automation Overview report shows a list of all the automations you have in place, including the number of campaigns each one contains and the number of contacts who entered it. If you’re using a lot of automations, you can filter by the label to find the one you want.
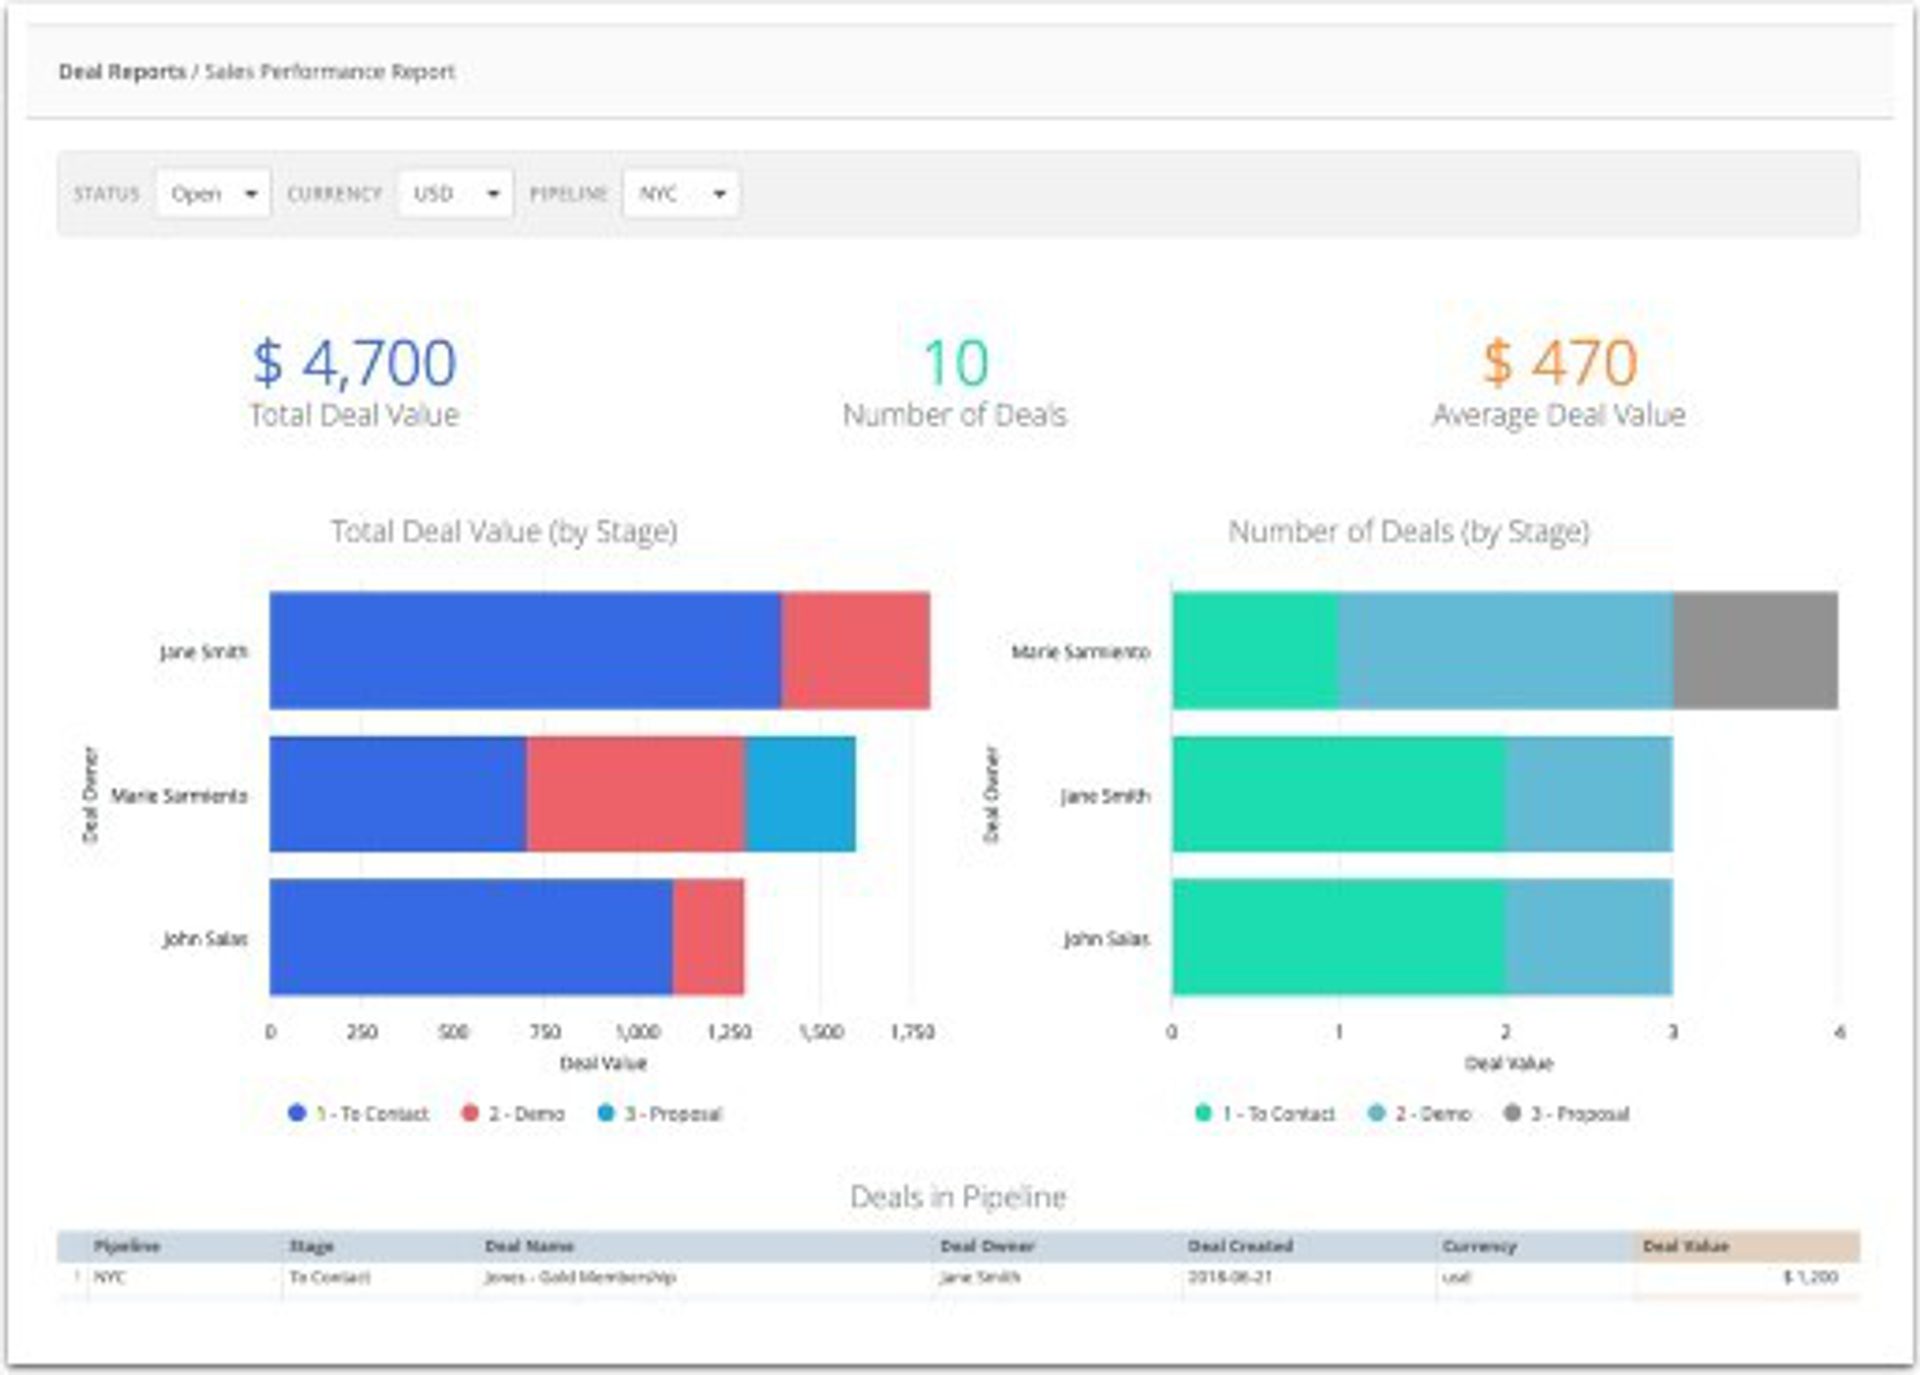
Sales Performance report
The Sales Performance report provides a view of sales performance metrics like total deal value, total number of deals, and average deal value. Visual bar graphs show deals sorted by stage and by sales rep.
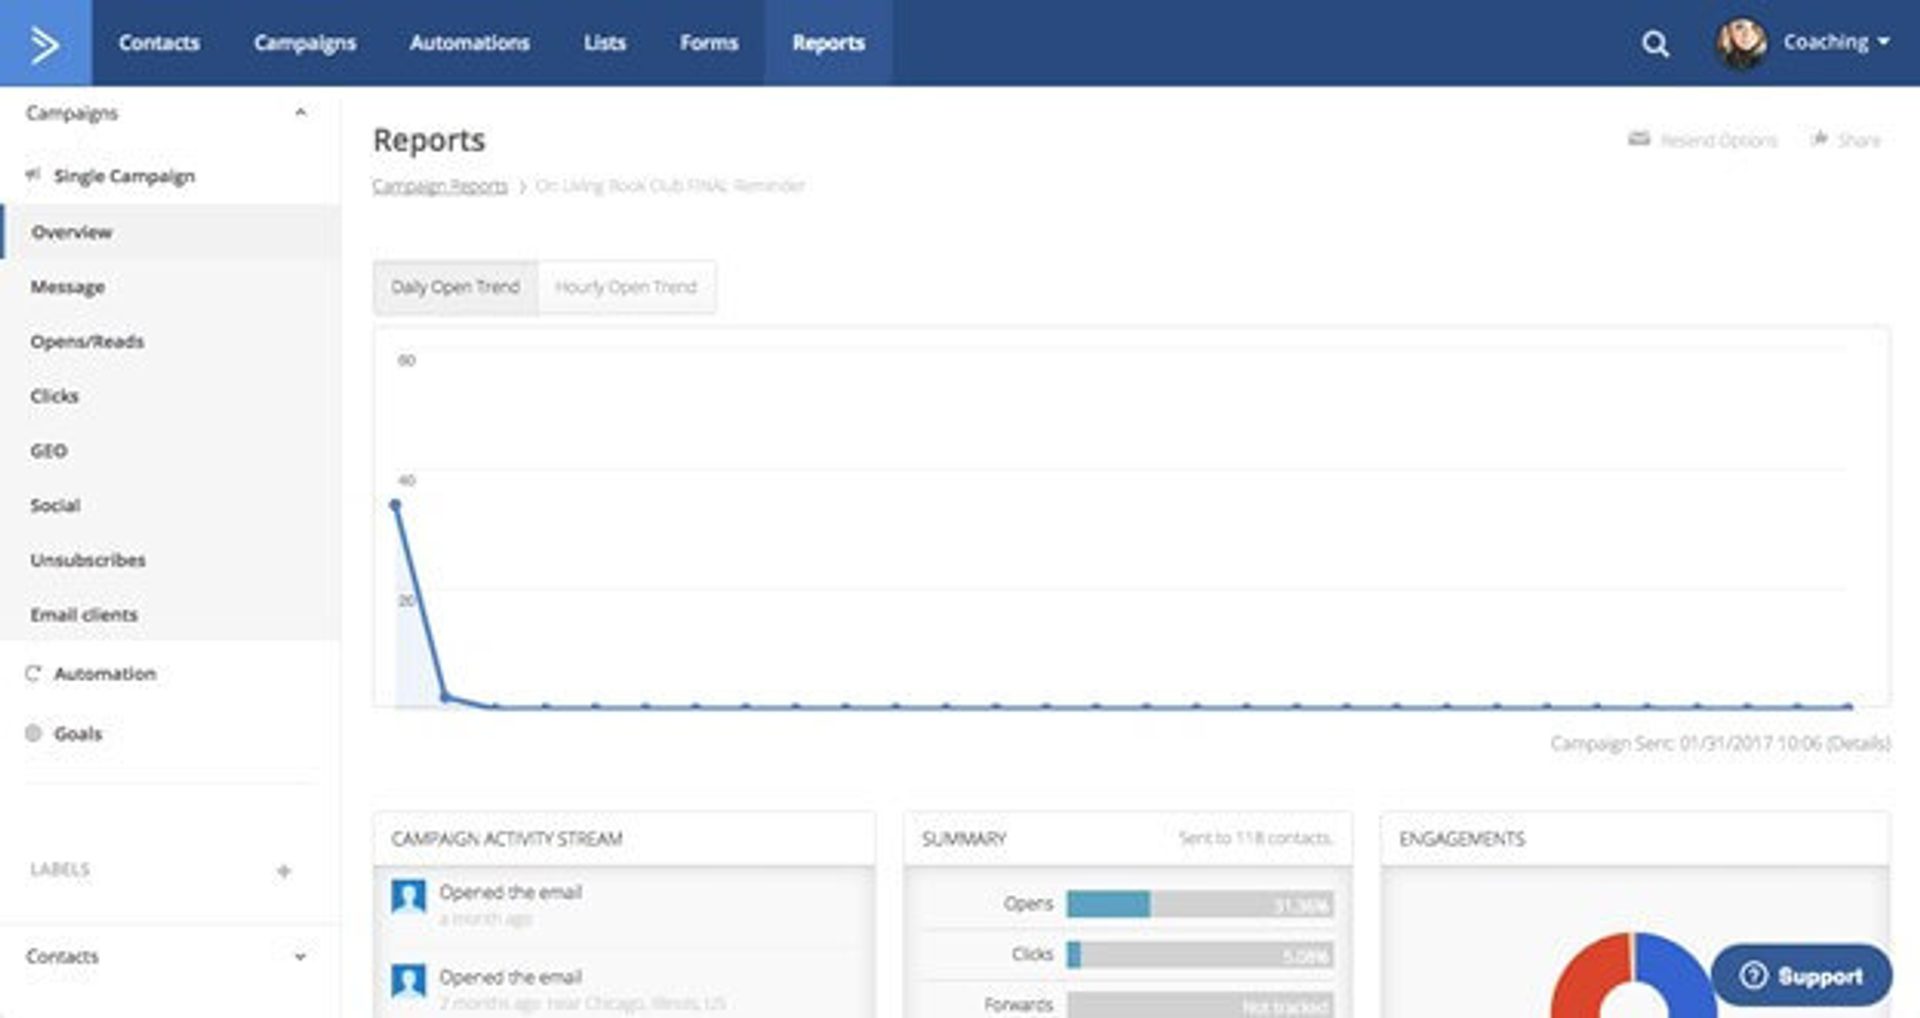
Email Campaign Performance report
The Campaign Performance report lets you see data on all marketing email campaigns sent from your account. You can view metrics like the number of sends, opens, clicks, unsubscribes, and bounces.
If you’re conducting split tests on your campaigns, this dashboard will show you the test data.
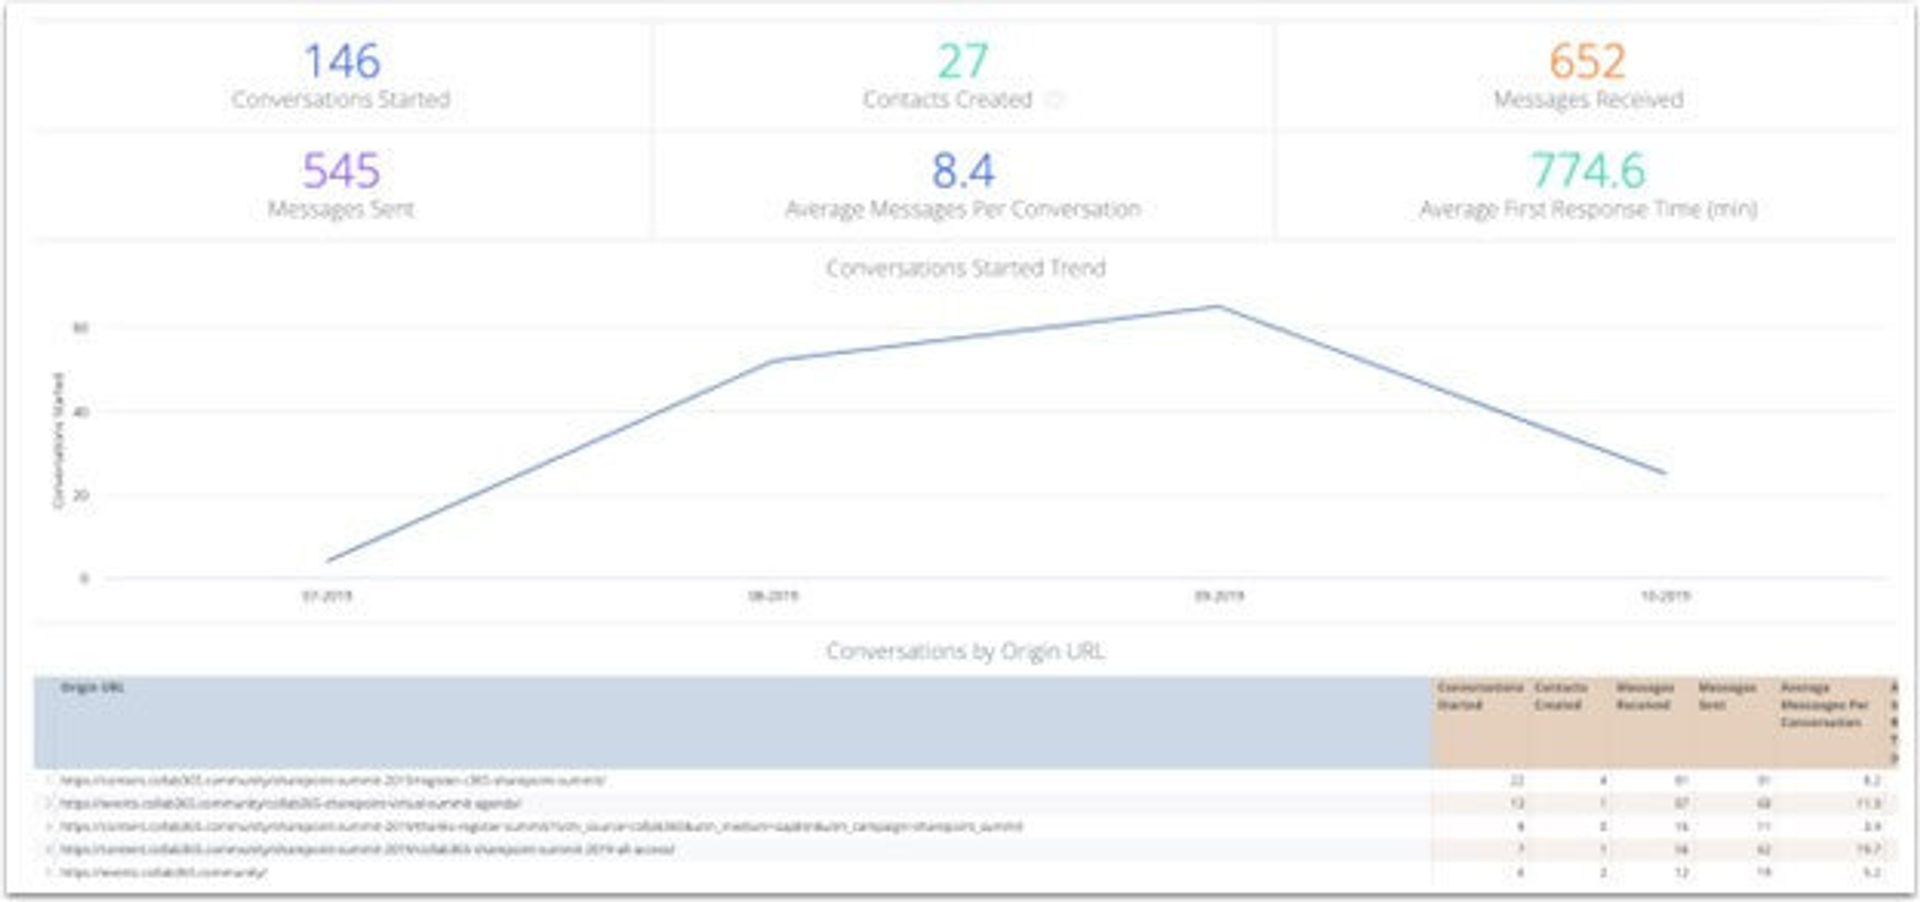
Chat Conversation report
The Chat Conversation report displays performance metrics of all interactions happening through Conversations. You can see the originating URL of conversations, the number of contacts acquired, the average response times, and the most commonly used device types.
Real-world applications of CRM dashboards
Large and small businesses alike benefit from CRM dashboards. The companies below are just two use cases of ActiveCampaign CRM dashboards in the real world.
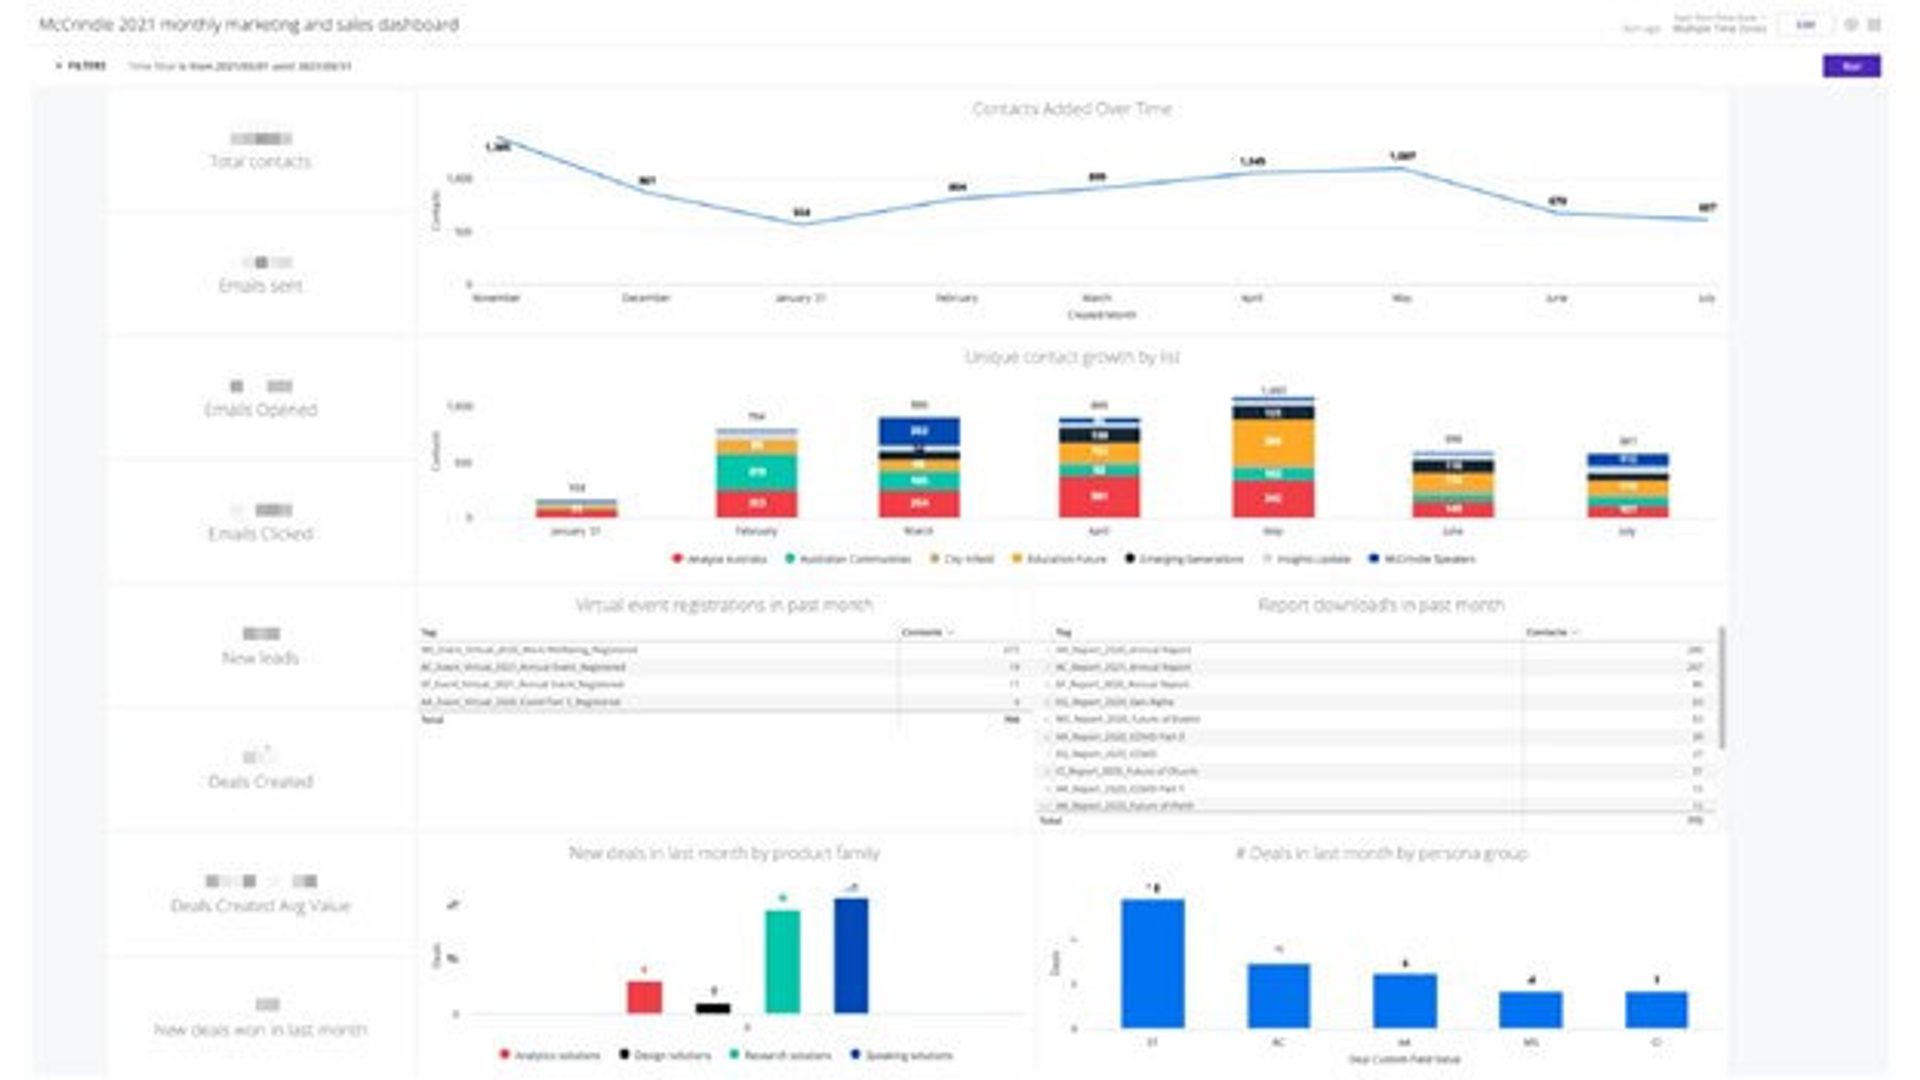
McCrindle
McCrindle is an Australian-based social research, demographics, and data analytics agency. As McCrindle grew, so did the challenges around lead generation and nurturing. It was hard to know how many incoming leads they had and what the customer journey looked like for each persona.
ActiveCampaign CRM changed that.
McCrindle now has custom dashboard reports that give the team visibility into the entire sales cycle. They can break down their data by pipeline, product, product family, or persona, giving them greater insight into the customer journey.
Your Therapy Source
Your Therapy Source provides online resources for physical therapists, occupational therapists, educators, and parents.
In the beginning, Your Therapy Source founder Margaret wrote blogs and sent out emails with limited analytics, but as the business grew, she needed deeper insights into her campaigns.
Margaret says, “With the marketing dashboard in ActiveCampaign, the data is right in front of me. I can see exactly how much I’m earning from each email and automation. It drives your motivation like no other to see that direct relationship between how much effort you invest in your email marketing and then the return on time and investment.”
Conclusion
CRM dashboards can give you better insight into your performance, improve decision-making, and help you forecast future sales.
Ready to get started with customizable, real-time CRM dashboards? Try ActiveCampaign free for 14 days.