If you're running an ecommerce business, you know that tracking your performance is critical to success. But how do you know if you're on the right track? That's where ecommerce key performance indicators (KPIs) come in. By measuring the right ecommerce KPIs, you can evaluate your overall performance and ensure you're optimizing your return on investment (ROI) using tools like Google Analytics.
Ecommerce KPIs provide a way to measure the effectiveness of your business over a specific time period. By tracking KPIs, you can assess the overall performance of your business, as well as specific areas like sales, marketing, and customer service, including customer acquisition costs.
In this post, we'll examine ecommerce KPIs, why they are essential for your business, and provide an overview of the five key ecommerce KPIs so you can start measuring your success today.
The five key ecommerce KPIs you need to know
To get started with ecommerce KPIs, it's essential to understand the five key metrics every ecommerce business should track.
These ecommerce metrics include:
- Revenue per customer (RPC)
- Customer Lifetime Value (CLV)
- Email click-through Rate (CTR)
- Profit margin (PM)
- Average daily attendance (ADA)
When measuring ecommerce success, these five key performance indicators provide a clear picture of how well the business is performing and can help identify areas for improvement.
Let's take a closer look at the five key ecommerce KPIs, how to calculate them, and how they can help you measure your ecommerce success.
"Tracking and monitoring your KPIs is essential for the success of your ecommerce business. By understanding your KPIs, you can identify areas of improvement and make data-driven decisions to optimize your sales and marketing strategies."
John Lee, CEO of Prosperous Digital AgencyRevenue per customer (RPC)
Revenue per customer, or RPC, is a critical KPI for any ecommerce business. It measures the amount of revenue generated from each customer, providing valuable insights into the effectiveness of the business's sales and marketing efforts.
This metric takes into account all of the revenue generated by a customer over their lifetime with the business and represents the average amount of revenue generated per customer. Businesses can use this KPI to determine each customer's value, identify which customers are the most valuable, and optimize their marketing budgets. This information can help them focus their marketing and sales efforts.
How to calculate RPC
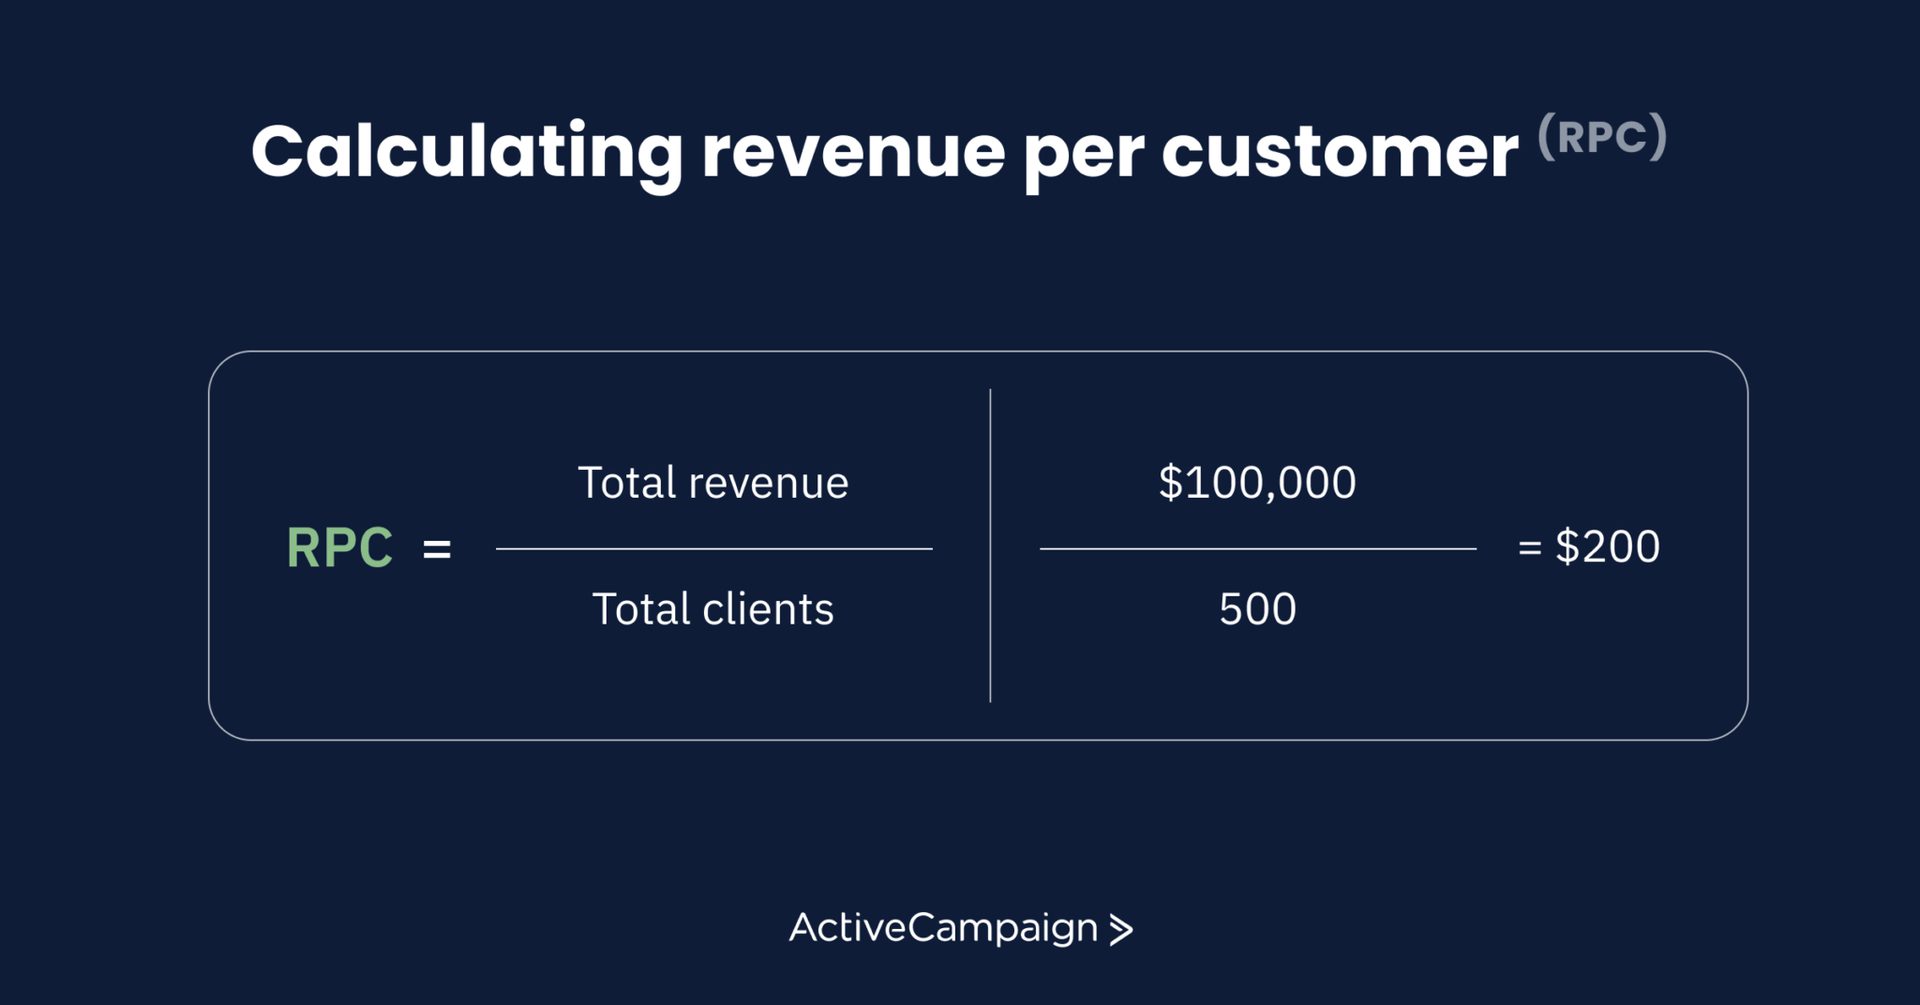
To calculate RPC, divide the total revenue generated by the number of customers. For example, if a business generated $100,000 in revenue and had 500 customers, the RPC would be $200.
How businesses can use RPC to improve performance
Businesses use RPC to identify growth opportunities and improve their overall performance. For example, a business may find their RPC lower than expected, indicating that they need to focus on increasing revenue growth from each customer. They could do this by implementing upselling and cross-selling strategies, leveraging search engine optimization and organic search to attract more customers, or improving their customer experience to encourage repeat purchases.
Customer lifetime value (CLV)
Customer lifetime value, or CLV, is another essential ecommerce KPI that measures the total value a customer brings to the business over the course of their relationship. It is the total revenue a customer is expected to generate over their lifetime with the business. By calculating CLV, businesses can determine the long-term value of their customer relationships and make informed decisions about where to allocate resources.
How to calculate CLV
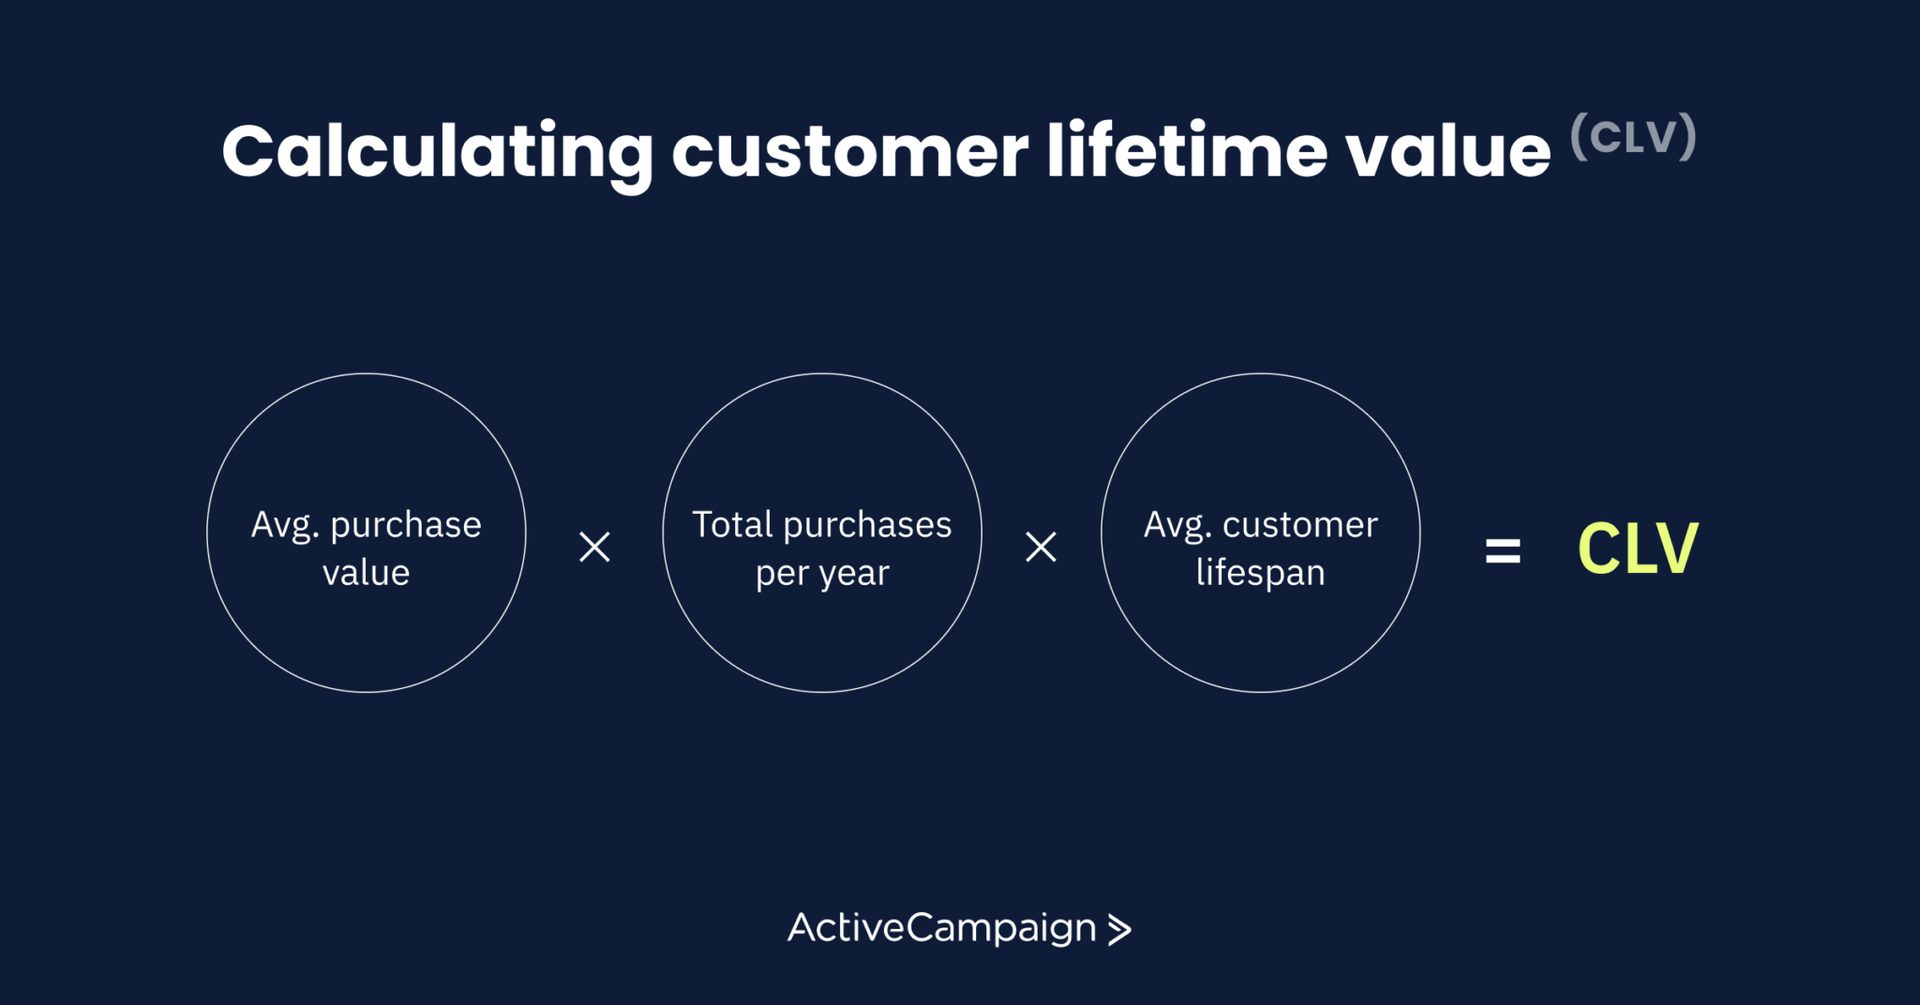
To calculate CLV, businesses need to consider several factors, including the average purchase value, the frequency of purchases, and the length of the customer relationship.
A simple formula for calculating CLV is:
CLV = average purchase value x number of purchases per year x average customer lifespan
How businesses can use CLV to improve performance
CLV is used to identify a company's most valuable customers and where to focus their marketing and sales efforts. For example, a business may find their CLV higher for customers who purchase certain products or come from a particular marketing channel. They could then focus their marketing efforts on those products or channels to attract more high-value customers and increase their overall CLV.
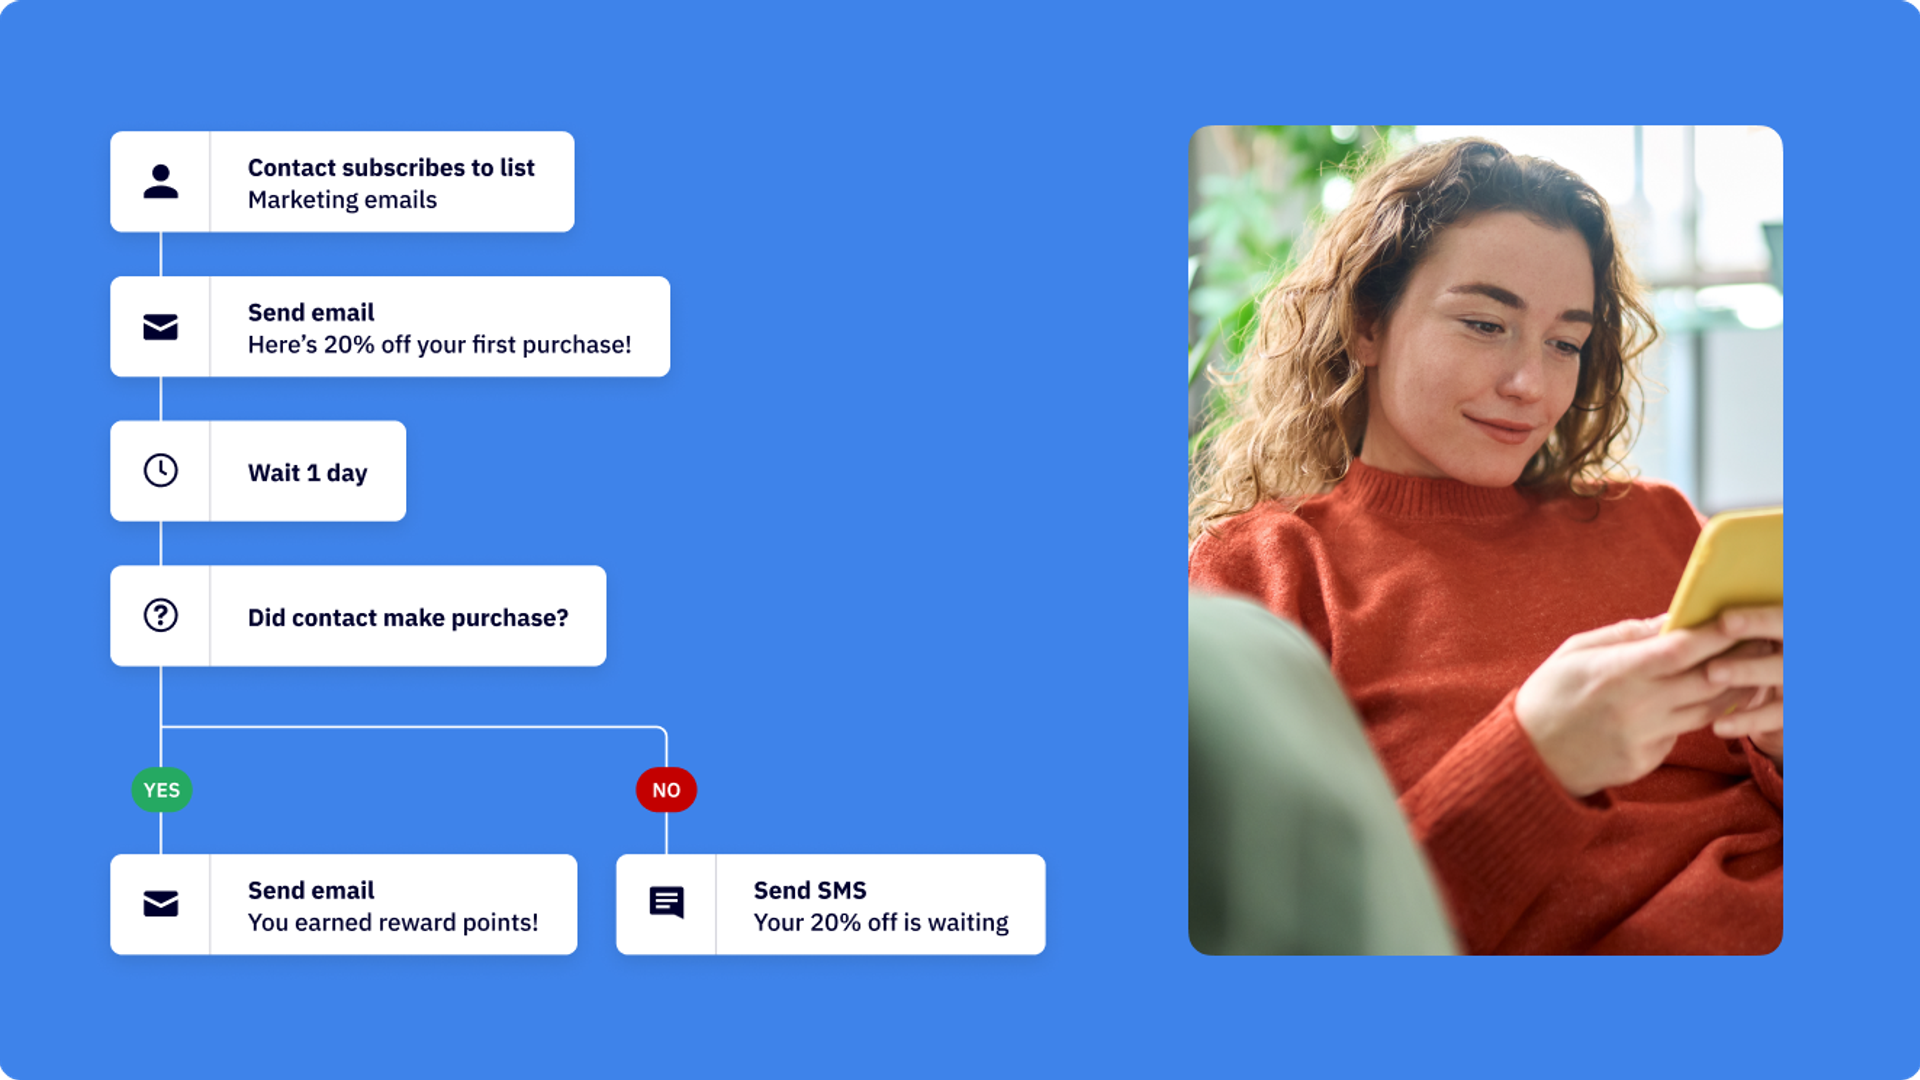
Email click-through rate (CTR)
Email marketing is one of the most effective ways to reach and engage customers, and the email click-through rate (CTR) is an important marketing KPI that measures how engaging an email is to its recipients. This can help you optimize your marketing expenses and achieve a better cost of customer acquisition. A higher CTR indicates that the email content and messaging resonate with the audience, leading to a higher likelihood of conversions.
This KPI is important to help measure a business's email campaign effectiveness. If the CTR is low, it could indicate that the email content is not relevant or engaging to the audience. Conversely, a high CTR means the email resonates with the audience and drives more traffic to the website.
How to calculate CTR
To calculate CTR, divide the number of clicks an email receives by the number of emails delivered. Then, multiply the result by 100 to get the percentage.
CTR = (number of clicks / number of emails delivered) x 100
For example, if an email campaign received 500 clicks and was delivered to 10,000 recipients, the CTR would be 5%.
How businesses can use CTR to improve performance
CTR is used to improve the performance of your email campaigns in several ways, such as analyzing the percentage of customers who engage with your emails. To increase your CTR, you can experiment with different subject lines, email content, or calls to action to see what resonates with your audience. You can also segment your email lists to ensure the content is relevant to each group of recipients.
Additionally, you can use CTR to measure the effectiveness of various types of email campaigns, such as promotional emails, newsletters, or abandoned cart emails. By analyzing the CTR for each type of email campaign, you can optimize your email marketing strategy and improve overall performance, including lowering your shopping cart abandonment rate.
Profit margin (PM)
Profit margin (PM) is a financial ratio that measures how much profit a business makes for every dollar in revenue. It's a critical KPI for ecommerce businesses because it helps owners and managers understand how much money they're making on their products and services.
A high PM means that the business is efficient in controlling its costs, pricing its products effectively, and generating profits. On the other hand, a low PM indicates that the business is spending too much on costs, underpricing its products, or struggling to make a profit.
This is why understanding PM is essential. It allows you to analyze your financial performance and make informed decisions. By tracking PM, you can identify areas where you can reduce costs or increase prices to improve profitability.
How to calculate PM
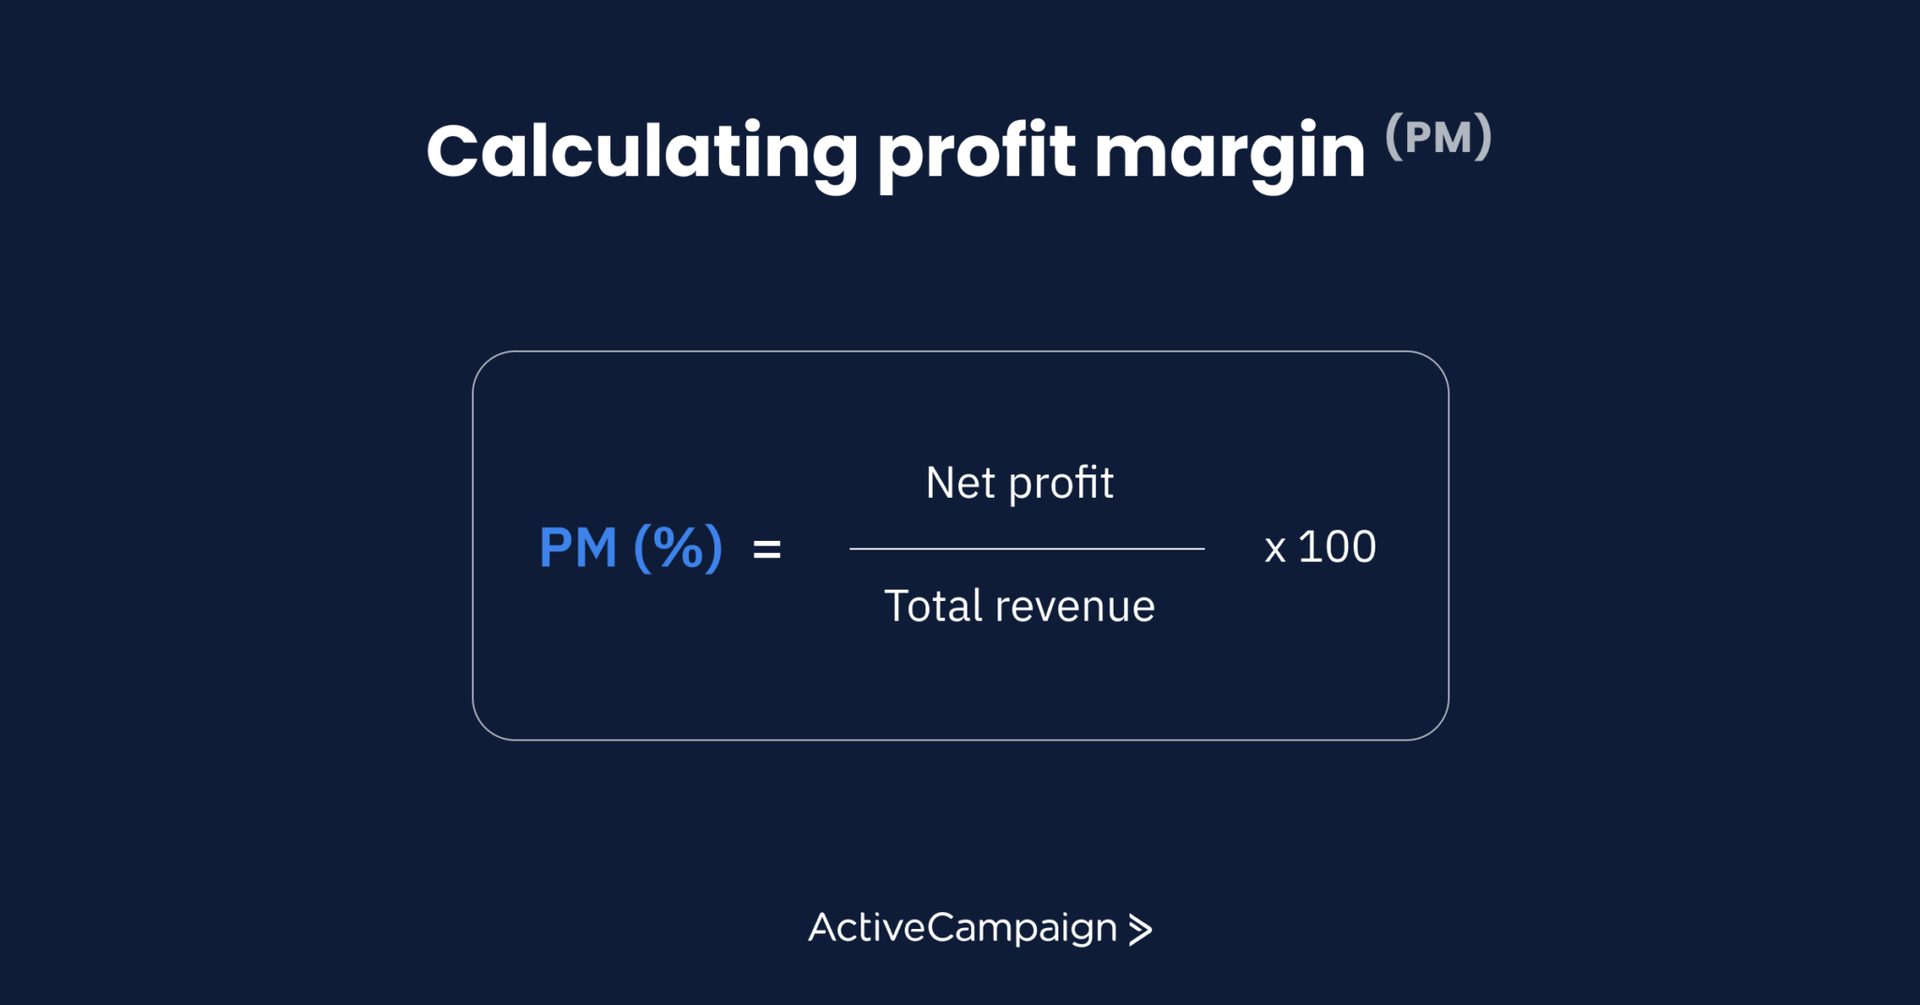
PM is calculated by dividing a business's net profit by its total revenue. The resulting percentage is the profit margin.
Profit margin (%) = (net profit / total revenue) x 100
For example, if a business generates $500,000 in revenue and has a net profit of $100,000, its PM would be 20% ($100,000 / $500,000 x 100).
How businesses can use PM to improve performance
PM can be used by ecommerce businesses in various ways to improve their performance.
- Cost management: PM can help businesses identify areas where they're overspending and cut costs, effectively managing expenses and optimizing profit margins. At the most basic level, you can increase your profit margins and improve your bottom line by reducing expenses.
- Pricing strategy: PM can help businesses set their prices more effectively. If your PM is low, you may need to increase your prices to generate more profits. Conversely, you might consider lowering your prices to attract more potential customers if the PM is high.
- Product mix: PM can help businesses determine which products generate the most profits by analyzing the PM for individual products. This will help you focus on the most profitable items.
By tracking PM regularly, you can improve your profitability and achieve long-term success as an online business retailer by optimizing overhead costs and online sales.
Average daily attendance (ADA)
Average daily attendance (ADA) is an important metric that measures how many visitors come to your online store daily, including organic traffic and traffic from advertising campaigns on various social media platforms. ADA can provide insight into the performance of your website and can help identify areas that need improvement.
It is an essential KPI because it can help you track your website's traffic growth over time, identify trends in your traffic patterns, and help identify customer expectations. If your ADA is consistently increasing, it can indicate that your marketing efforts are effective, and the percentage of visitors to your website that are generally happy with your user experience is high.
How to calculate ADA
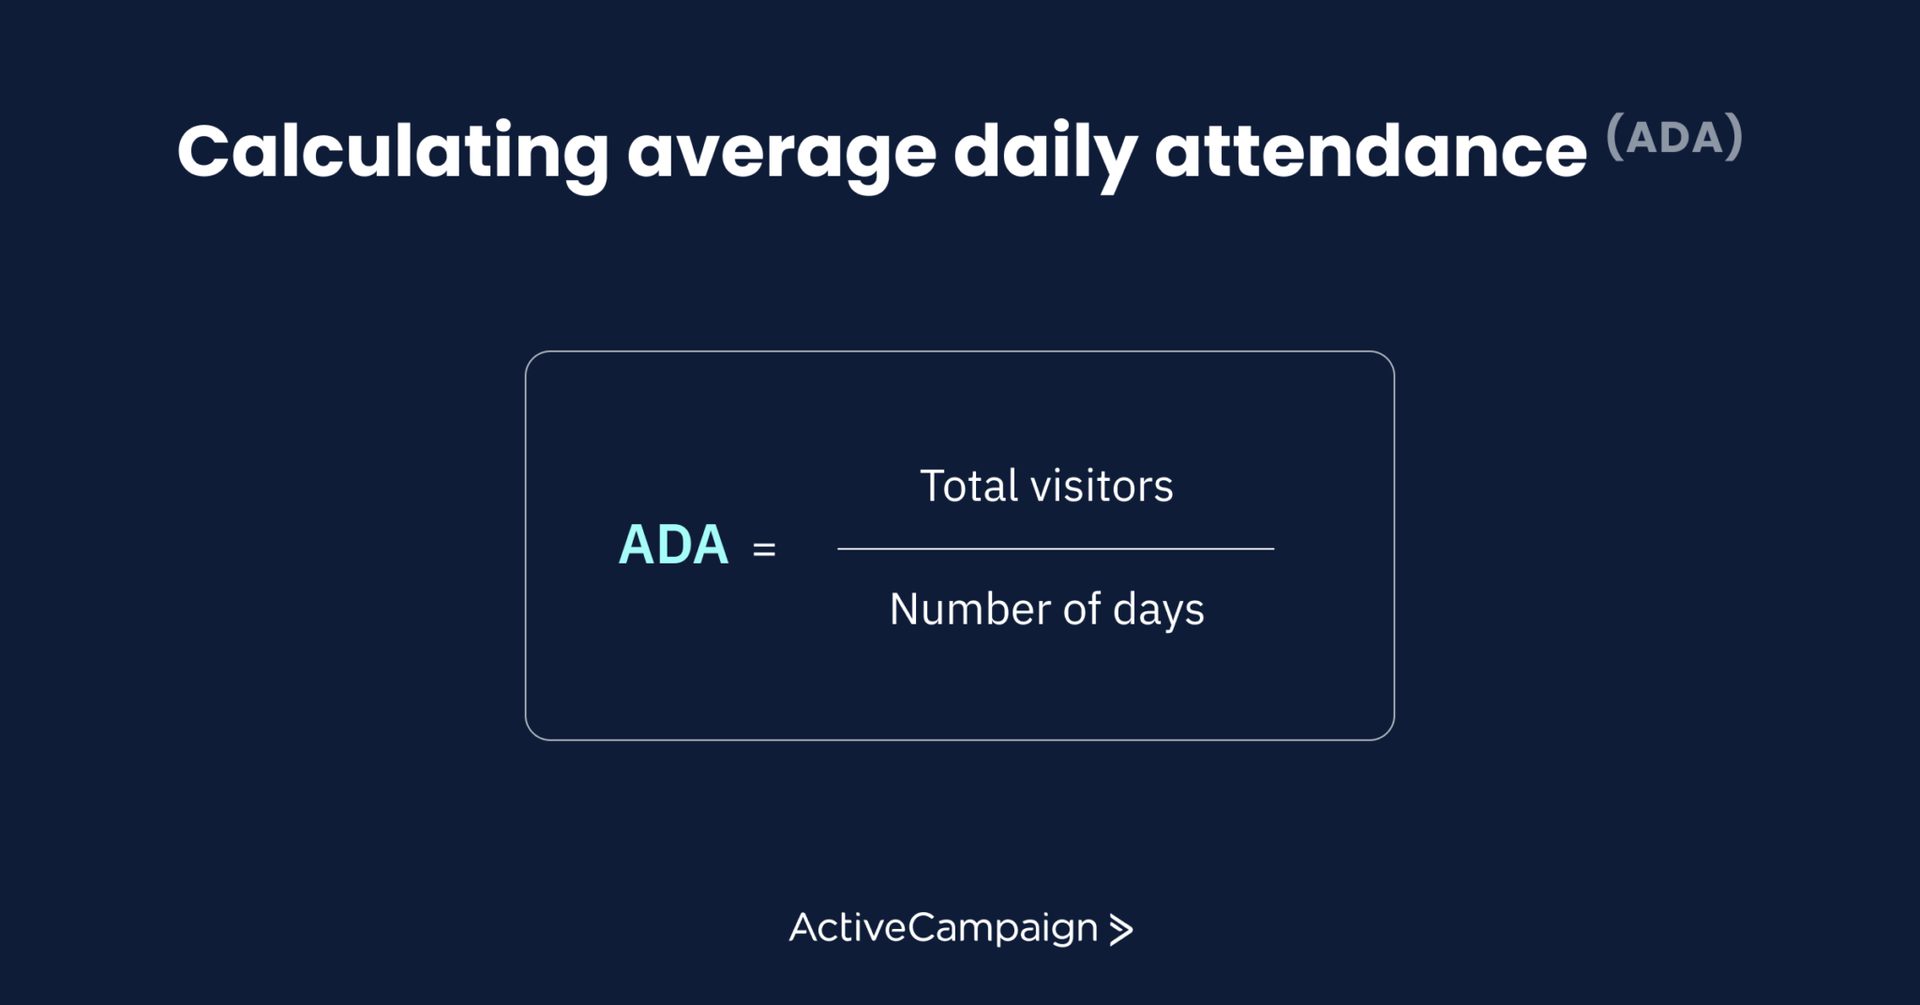
To calculate ADA, you can use the following formula:
ADA = Total visitors / Number of days
For example, if you have 10,000 visitors to your website over 30 days, your ADA would be:
ADA = 10,000 / 30
ADA = 333.33 visitors per day
How businesses can use ADA to improve performance
ADA can be used to identify potential issues with your website's performance, such as low traffic or high bounce rates, and provide actionable insights for conversion rate optimization. By tracking ADA over time, you can also identify trends in your traffic source patterns and adjust your marketing strategies accordingly, such as focusing on the most effective social media platform for your business.
For example, if you notice that your ADA is decreasing over time, it may indicate that your website is not performing as well as it could be. You may need to improve your conversion rate optimization efforts or adjust your return rate policy.
On the other hand, if you notice that your ADA is increasing over time, it can be a positive sign that your marketing efforts, such as advertising campaigns or social media engagement, are paying off and your percentage of customers making purchases is growing.
In addition, ADA can also be used to measure the effectiveness of specific digital marketing campaigns or promotions, including subscriber list growth and unsubscribe rate, as well as the success of your product descriptions in driving up conversion rates. By tracking ADA before, during, and after a campaign, you can measure the campaign's impact on your website traffic (and mobile site traffic) to make informed decisions about future marketing efforts.
"Ecommerce KPIs provide valuable insights into the performance of your online store. They help you identify what’s working, what’s not, and where you need to focus your efforts to drive growth."
Linda Bustos, Director of Digital Experience at Elastic PathSetting benchmarks and business goals for KPIs
While understanding and tracking ecommerce KPIs is important, setting benchmarks and goals for each metric is equally important. Benchmarks serve as a reference point for evaluating performance, while goals give you something to work towards and measure success against.
When setting benchmarks and goals for your ecommerce KPIs, it's important to consider your business's unique circumstances, such as industry benchmarks and historical performance. Setting achievable yet ambitious goals can motivate and push your team toward continuous improvement.
It's also important to regularly review and adjust your benchmarks and goals as your business evolves and external factors change. This can help ensure that your KPIs remain relevant and meaningful to your business and that your team focuses on the right ecommerce KPIs to drive performance.
Setting benchmarks and goals for your ecommerce KPIs helps keep your team focused, motivated, and accountable for driving business success.
Now that you've got a better idea of the KPIs you can track to measure success, discover how the ActiveCampaign platform can help you grow your e-commerce sales and customer base.
Strategies for improving performance based on KPI data
Once you set benchmarks and goals for your ecommerce KPIs, it's time to take action based on the insights gained from the data. Here are some effective strategies for improving performance based on KPI data.
Optimization of marketing campaigns
Ecommerce businesses can optimize their marketing campaigns using data from KPIs such as CTR and RPC. This data can help you adjust your marketing strategies by analyzing which campaigns perform well. For example, if an email campaign has a low CTR, you can modify the subject line and email content to make it more appealing to customers. Similarly, you can adjust the messaging to better resonate with the audience if a social media campaign has a low average conversion rate.
Try our free subject line generator for some inspiration.
Identifying areas of improvement in product offerings
By analyzing KPI data such as PM and CLV, you can identify areas of improvement in your product quality and offerings. For example, if a particular product has a low PM, you can adjust the pricing or manufacturing costs to improve profitability. Similarly, you can consider enhancing product features or adding complementary product bundles to improve customer satisfaction, customer loyalty, and the customer journey as a whole if a particular product has a low CLV.
After all, a satisfied customer is a customer that returns.
Improving customer service and support
KPIs such as NPS and ADA can provide valuable insights into the customer journey. By tracking these metrics, you can identify areas of improvement in your customer service and support offerings. If the NPS score is low, you can invest in training your customer support team representatives to your improve customer satisfaction score. Similarly, you can improve your customer service hours or online support resources if the ADA is low.
Analyzing and adjusting pricing strategies
KPI data such as PM and RPC can help you analyze and adjust your pricing strategies. For example, if the PM is low, consider adjusting your pricing or offering discounts to increase sales volume and improve profitability. Similarly, if the RPC is high, consider offering premium products or services to maximize revenue per customer.
By understanding the profit margins and revenue generated from each customer, you can identify the most profitable pricing tiers and adjust your pricing accordingly. This may involve considering factors like shopping cart abandonment rate, purchase rate, customer retention rate, and any vanity metrics you may have.
Implementing these strategies and continuously monitoring KPI data will help your ecommerce business improve your performance and achieve your goals.
"Ecommerce KPIs allow businesses to measure their success against their goals, identify areas for improvement, and make data-driven decisions to optimize their ecommerce operations. By tracking and analyzing KPIs, businesses can gain a competitive edge in the ecommerce marketplace."
Shabbir Nooruddin, Founder and CEO of Win Win ConversionExamples of ecommerce KPIs in action
Let’s look at a few real-life examples of ecommerce businesses that have successfully used KPIs to improve their performance.
XYZ Clothing Co.
XYZ Clothing Co. is a mid-sized apparel brand that sells its products through their own ecommerce store and various marketplaces. The company faced challenges with low customer retention rate and high cart abandonment rates. They started tracking two key KPIs to address these issues: customer lifetime value (CLV) and cart abandonment rate (CAR).
By analyzing the CLV of their customers, they were able to identify that their most valuable customers were those who made repeat purchases over a period of time. This led the company to focus on building customer loyalty through personalized marketing campaigns and offering incentives to repeat customers.
Additionally, by closely monitoring the CAR, they identified specific areas in their checkout process that were causing customers to abandon their carts. By making small adjustments, such as simplifying the checkout process and providing more payment options, they were able to reduce their CAR by 25%.
Amazon
Amazon is a global ecommerce giant that sells various products, ranging from electronics and apparel to home goods and groceries. One of the KPIs that Amazon uses is revenue per customer (RPC). By analyzing RPC, Amazon can identify which products drive the most revenue and which customers spend the most money. This allows them to make data-driven decisions about product offerings, pricing, and marketing campaigns.
Another KPI that Amazon uses is email click-through rate (CTR). Amazon's email campaigns are carefully crafted to encourage customers to purchase, so a high CTR is essential for success. By analyzing CTR data, Amazon can determine which email campaigns are most effective and which types of products resonate with their customers.
Warby Parker
Warby Parker is an ecommerce company that sells affordable and stylish eyewear that uses customer lifetime value (CLV) as a primary KPI. By analyzing CLV, they can determine which customers are most valuable and which marketing campaigns are most effective in retaining customers. They can also identify which products will most likely lead to repeat purchases, allowing them to optimize their product offerings.
Another KPI that Warby Parker uses is profit margin (PM). By analyzing PM data, Warby Parker can determine which products are the most profitable and which may need re-evaluation. They can also use PM data to analyze pricing strategies and adjust prices as needed to maximize profitability.
These examples demonstrate how ecommerce businesses can optimize their operations and drive growth and profitability by tracking and analyzing KPIs.
Over to you
Ecommerce KPIs are critical metrics for measuring the success of an online business. By regularly tracking and analyzing these KPIs, businesses can identify areas for improvement and optimize their strategies for better performance.
It is crucial for businesses to establish benchmarks and goals for their KPIs to ensure they are making progress toward their objectives. By implementing strategies such as optimizing marketing campaigns, identifying areas for improvement in product offerings, optimizing the routes for drivers, improving customer service and support, and analyzing and adjusting pricing strategies, businesses can use KPI data to make informed decisions that drive growth and success.
To further enhance e-commerce KPI tracking and analysis, ActiveCampaign's marketing automation and CRM platform offers a free 14-day trial to get you started. Our robust suite of tools can help businesses track and analyze key metrics like revenue per customer, customer lifetime value, email click-through rate, average profit margin, and average daily attendance to improve their ecommerce strategies.
Sign up below.