This post was updated on August 5th, 2022.
How do you know if your new CRM system is working?
This is an important question to ask because if it isn’t…
- Sales doesn’t have the information or tools they need to convert marketing leads
- Leads stall at certain parts of the sales cycle, fall through the cracks, or take way too long to close
- Customers don’t stick around
- Marketing, sales, and customer support don’t share information or insights
- Your customer support team works overtime but can’t get through all of the tickets
But how can you tell without waiting to see if any or all of that happens? By tracking CRM metrics.
Metrics are numbers that tell you whether something’s working the way it should. Your CRM affects teams and goals across your business—so you need to know it’s working!
In this post, you’ll learn how to:
- Set measurable CRM goals
- Determine how well you’re closing valuable deals with sales metrics
- Figure out if you’re marketing the right message to the right people with marketing metrics
- Learn how well you’re meeting customers’ needs with customer service metrics
- Run the right CRM reports to measure success
Let’s dive into the world of CRM metrics!
Table of Contents
- Set measurable CRM goals
- Sales metrics: How well are you closing valuable deals?
- Marketing metrics: Are you marketing the right message to the right people?
- Customer service metrics: How well are you meeting your customers’ needs?
- Run the right CRM reports to measure success
- The (success) story is in the data
Set measurable CRM goals
“What gets measured gets managed.” -Peter Drucker, The Price of Management (1954)
To measure CRM success, you need to set SMART goals:
- Specific
- Measurable
- Achievable
- Relevant
- Timely
Setting measurable goals upfront makes it easier to measure the effectiveness of your CRM later on. (Read here to learn more about setting SMART CRM goals.)
To make goals measurable, you need to assign key performance indicators (KPIs) to each. A KPI is a quantifiable measure used to determine how well a company meets its goals. The KPIs tell you if your CRM strategy works and whether or not you’re on track to meet your CRM goals.
If your goal is to increase customer retention, you wouldn’t measure the number of open sales opportunities. If your goal is to shorten your sales cycle, you wouldn’t measure your email list growth rate.
What CRM metrics should you track?
- Close rate
- Upsell rate
- Net-new revenue
- Length of each sales pipeline stage
- Length of sales cycle
- Customer lifetime value (CLV)
- Customer acquisition cost (CAC)
- Revenue generated by campaign
- Email list growth rate
- Net promoter score (NPS)
- Churn rate
- Average time to resolution
- Average number of follow-ups per ticket
Sales metrics: How well are you closing valuable deals?
What does sales success look like for your business? Here are 5 metrics to measure sales team performance and CRM success.
1. Close rate
Your close rate is the number of deals closed compared to the number of leads in the pipeline. If you have 100 leads in your pipeline and only 10 close, your close rate is 10%.
It’s the holy grail of sales metrics.
Every sales team under the sun uses close rates as a measure of success—but close rates alone don’t always tell the whole story.
What’s the missing information? Let’s look at an example.
- Business #1 closes 75% of its deals.
- Business #2 only closes 5% of its deals but makes more money. How?!
The answer is a higher average deal size. This is why looking at the average deal size alongside close rates is important. How much are your closed deals actually worth?
Compare your close rate for the 6 months leading up to implementing a new CRM system with the 6 months after. If your CRM is doing its job, your close rate should increase.
If it decreases, it’s time to take a close look at your sales team's productivity and the quality of your leads.
2. Upsell rate
Upselling is essentially convincing the customer to spend more than they originally planned. Your upsell rate is how many customers buy things they weren’t originally planning to buy.
Let’s say you run sales for a home cleaning company. Upselling might involve selling customers:
- A year’s worth of monthly cleaning, instead of purchasing month-by-month
- Deep cleaning services instead of the basic option
If you convince 1 out of every 5 customers to upgrade their purchase, your upsell rate is 20%.
A CRM can help increase your upsell rate by helping you predict which leads are likely to upgrade or buy other products. If finding predictors increases your upsell rate, congratulations—your CRM works.
3. Net-new revenue
New revenue means spending from new customers.
How long a customer stays “new” depends on your business model.
- If you sell yearly subscriptions, new revenue is the revenue generated by customers within their first year.
- If you sell one-time products, new revenue is the revenue generated by customers’ first purchases.
Why measure net-new revenue? It tells you how much money your sales team is making. Tracking new revenue and close rates tells you how valuable your newest batch of customers is.
What can you do with the right CRM in place? You should be able to:
- Identify more high-value deals
- Close more high-value deals
- See your net-new revenue steadily increase

4. Length of each sales pipeline stage
How long does the average lead stay in each stage of your pipeline?
Stages are the steps in your pipeline (or sales process). Tracking stages helps you find bottlenecks in your sales process (like if deals tend to get stuck in a specific pipeline stage).
Let’s say leads stay in the proposal creation step 10x longer than any other step. Sure, creating proposals takes time, but how can you help your sales team move these leads to the next step faster?
- Is there a way to automate some of the proposal creation processes?
- Do you have proposal templates?
- If so, are they easy to use (and is your team using them)?
The more effective your CRM system is, the faster deals move through each stage of your pipeline. Which brings us to…
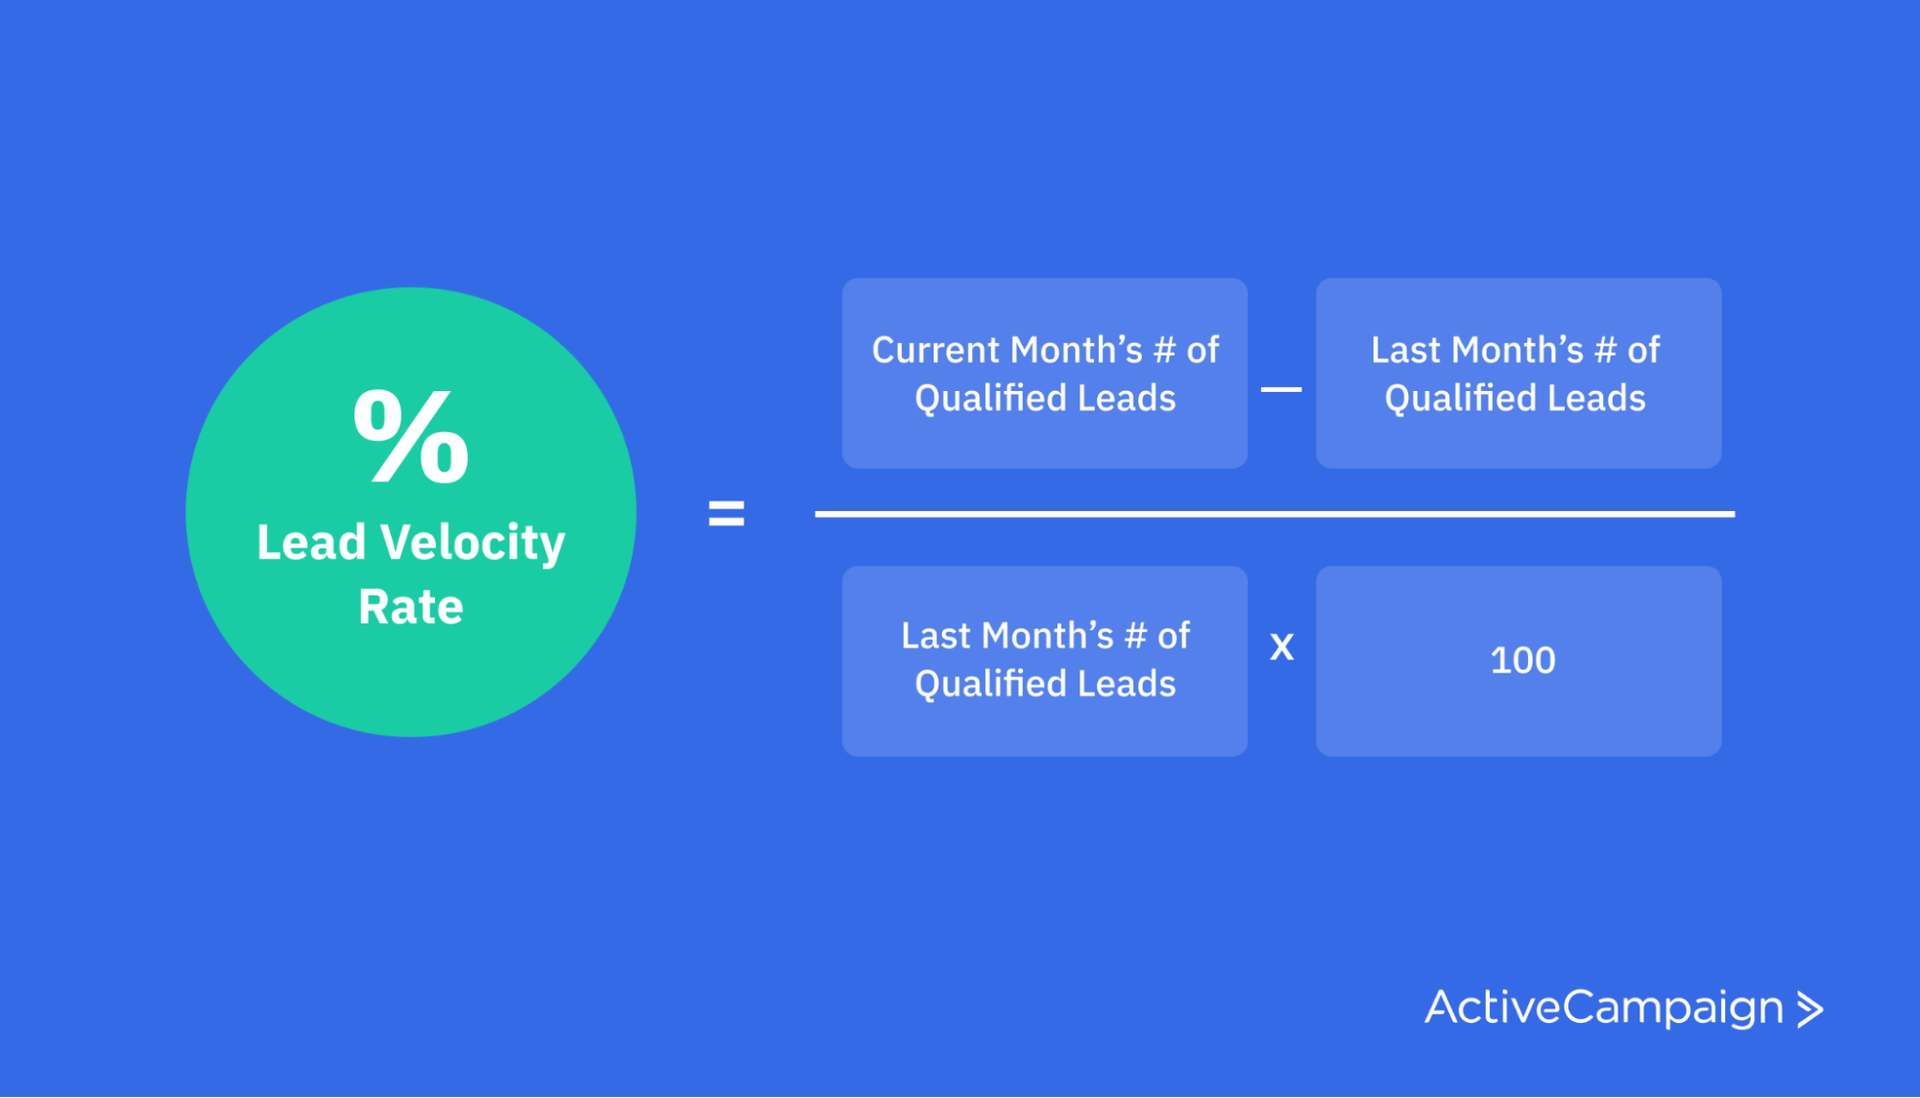
5. Length of sales cycle
Lead velocity measures how long the average deal takes to close. This is also sometimes called lead velocity, which sounds more fun (and science-y).
If a lead’s first conversation with your sales team is in early January, and they make a purchase or sign a contract in early July, your sales cycle is about 6 months long.
The number of decision-makers involved and the cost of your product or service are 2 factors that play a big role in the length of a sales cycle.
The more people involved in the decision to purchase, the longer it’ll take to close. The same goes for price: the more expensive the product or service, the longer the sales cycle.
While those factors may be out of your sales team’s control, you’ll want to speed up the sales process and close deals as fast as possible.
Which is exactly what CRM software was made for.
CRM makes your sales process more efficient, meaning you can sell more in less time. A match made in heaven!
Keep an eye on this metric over time to measure CRM success.
You can determine your lead velocity rate by subtracting the number of qualified leads from last month by the number of qualified leads this month. Then divide the number of qualified leads by the previous month’s qualified leads and multiply it by 100. (Quite a tongue twister, but it works!)
Marketing metrics: Are you marketing the right message to the right people?
Is your marketing team making the most of CRM? Here are 5 metrics you can use to measure marketing success.
6. Customer lifetime value (CLTV)
This metric predicts how much revenue you can expect from a single customer account.
To calculate CLTV, you need 4 pieces of information:
- Average purchase value: Your company’s total revenue over the course of a year divided by the number of purchases that year.
- Average purchase frequency rate: The number of purchases over a year divided by the number of unique customers who made purchases that year. This tells you how many times per year the average customer buys from you.
- Average customer value: The average purchase value multiplied by the average purchase frequency rate. This estimates how much money the average customer spends with you per year.
- Average customer lifespan: How long the average customer continues to purchase from your business.
Once you have all the above info, multiply the average customer value by the average customer lifespan. Voila: your company’s average CLTV.
The right CRM helps you increase the average customer lifespan by improving retention and satisfaction as well as target more high-value leads through your marketing.
When your customers spend more and stay longer, your CLTV goes up.
7. Customer acquisition cost (CAC)
Your CAC is the total sales and marketing spend required to close a customer:
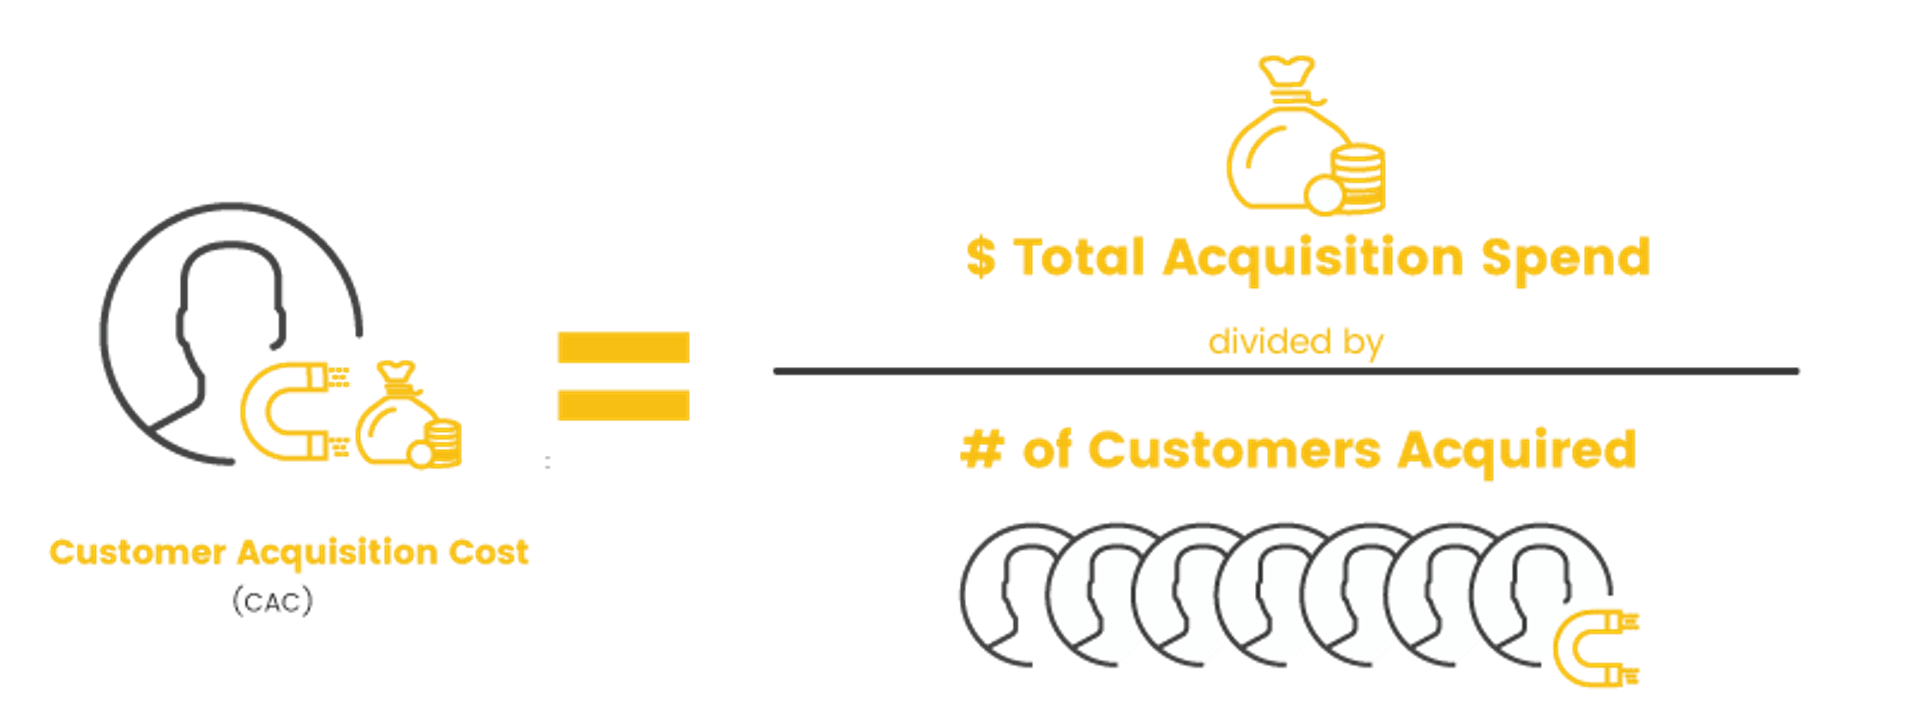
Effective CRM helps you lower your CAC by targeting more qualified leads and automating sales and marketing tasks.
When you target more qualified leads, you close more deals. Automation makes your marketing team more efficient, which saves you time and money. Combine the 2? Your CAC will drop.
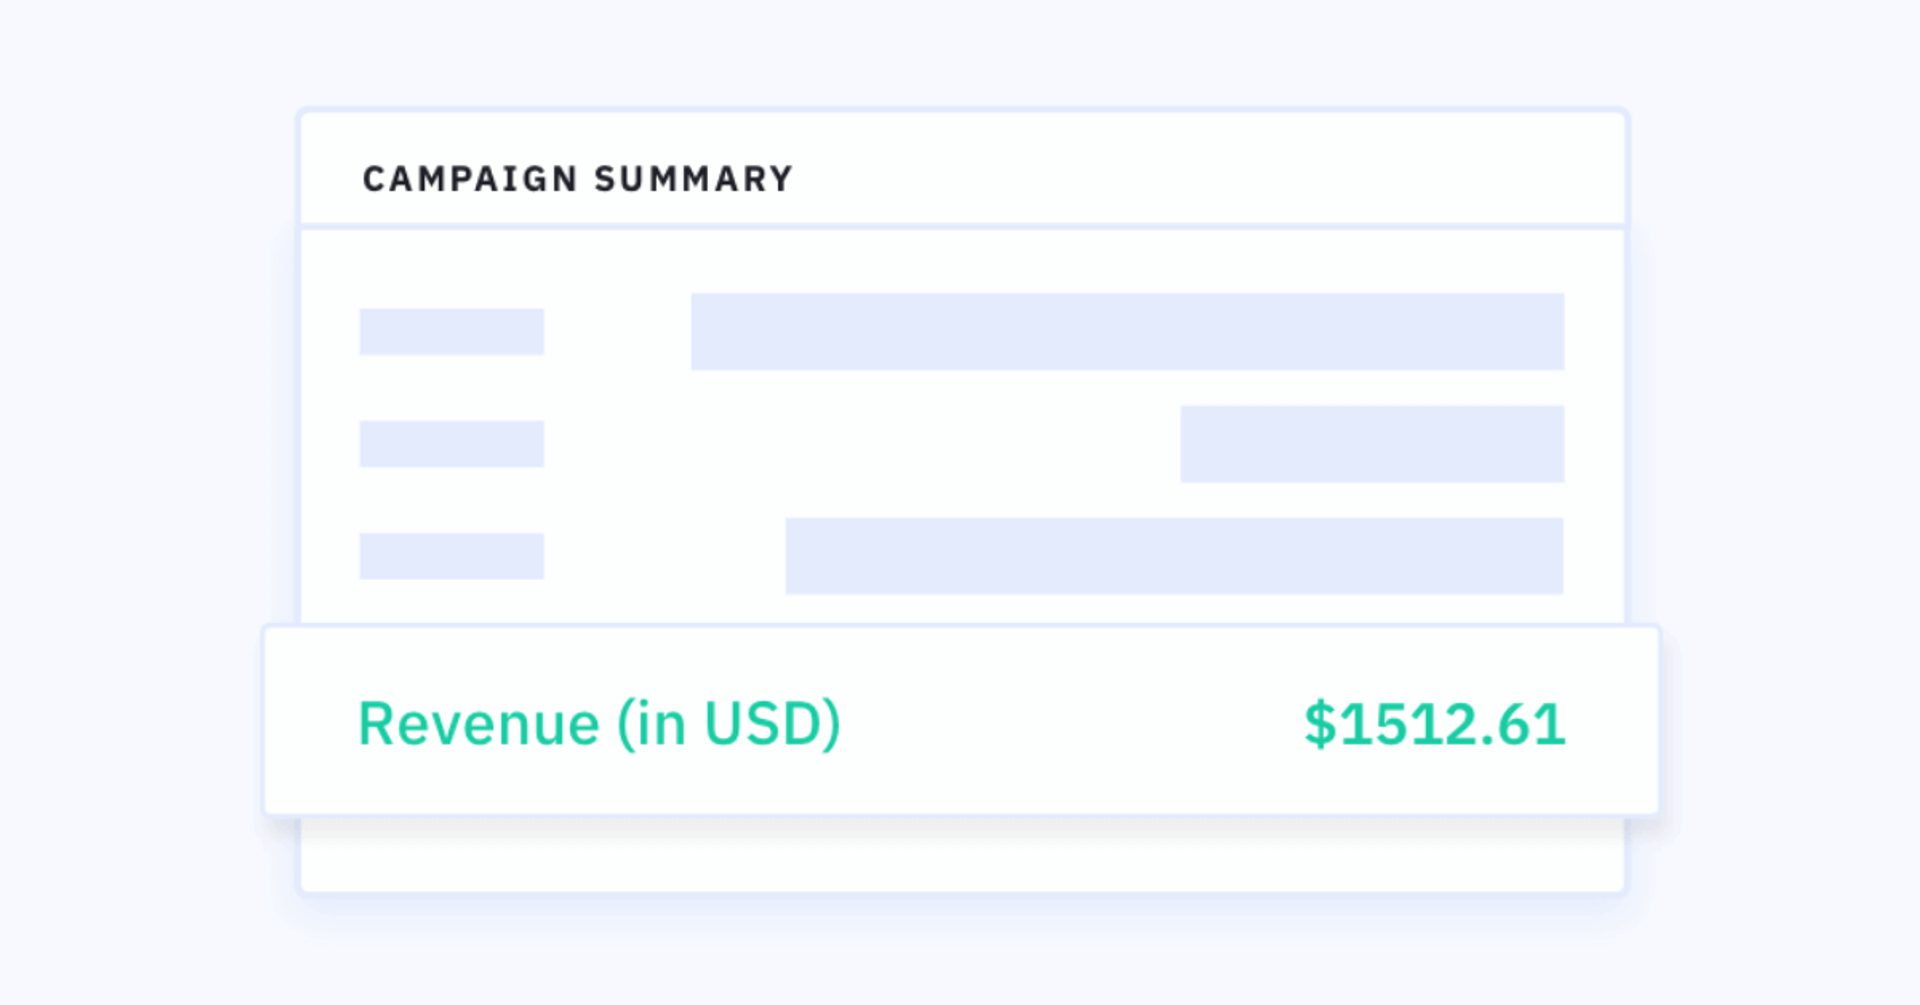
8. Revenue generated by campaign
How do you know that your email marketing campaigns work? Sure, you’re getting clicks, and your unsubscribe rate is low, but how does a series of emails contribute to your company’s bottom line?
The revenue generated by your campaign answers just that. If you run an ecommerce business, this metric is especially important. The goal for (almost) all email campaigns is to convince people to buy from you.
Breaking down how much you make from each campaign can help identify what resonates with your customers. This lets you test and improve:
- Email length
- Calls to action
- Subject lines
- Images
- “From” field
- Number of emails in the campaign
- Much more!
CRM gives you insight into customer behavior and preferences. Knowing your customers' wants helps you send the right messages to the right people.
9. Email list growth rate
This metric measures how much your email list grows over a specific period.
To calculate email growth rate:
- Subtract the number of unsubscribes from the number of new subscribers
- Divide by the total number of contacts on your list
- Multiply by 100
Say you have 500 new subscribers and 50 unsubscribes. Your list has 5,000 contacts total. Here’s the math:
- 500 new subscribers - 50 unsubscribes = 450
- 450 / 5,000 = 0.09
- 0.09 x 100 = 9% email list growth rate
Your CRM helps your marketing team increase this metric with:
- More opportunities for opt-in forms (pop-ups, gated content, etc.)
- More targeted emails → fewer unsubscribes
Customer service metrics: How well are you meeting your customers’ needs?
You might think of CRM as a way for sales and marketing to gain new customers—but it can also work wonders for keeping your existing customers happy. Here are 4 customer service metrics to measure.
10. Net promoter score (NPS)
How likely are your customers to recommend your business to someone else? NPS answers that question on a scale from 1 to 10.
To measure NPS, you need to send customers a survey with some variation of these questions:
- On a scale of 1 to 10, how likely are you to recommend our company to a friend or colleague?
- What made you choose that score?
Respondents are broken into 3 categories:
- Promoters (9–10): People who are really pumped about what your business has done for them (and want to shout it from the rooftops!)
- Passives (7–8): People who get what they want from your business but aren’t particularly excited about it
- Detractors (0–6): People who had a less-than-great experience and are likely to switch to a competitor
What does NPS have to do with CRM? (Besides fun acronyms?)
- CRM helps personalize the customer experience, which makes people happier (and more likely to give you a higher score!)
- CRM keeps all customer info in 1 place, letting you see a customer’s NPS and how it changes over time at a glance
- CRM lets you automate sending out NPS surveys and reporting on the findings.
You can automate sending out NPS surveys through ActiveCampaign. In this automation, NPS surveys are sent only to customers that have been active for longer than 6 months.
One caveat of NPS…
Before you get too excited about measuring NPS, you should know that this metric has its fair share of data-backed criticisms.
- NPS isn’t a strong indicator of retention
- NPS rarely correlates with churn
If you’re looking for a metric to predict churn and revenue, look elsewhere—like your financial and retention metrics.
As Patrick Campbell of ProfitWell says, “NPS is still useful, but likely only as a framework for identifying those customers on an individual basis who are raising their hands in frustration.”
Where NPS shines is as a pulse check at the account level. Regularly collecting customer feedback helps you address customer frustrations and stop would-be bad reviewers in their tracks.
You can also use NPS to find your biggest potential brand advocates. Right after a customer gives you a high NPS is a great time to automatically follow up and ask them to review you (or ask for a customer story).
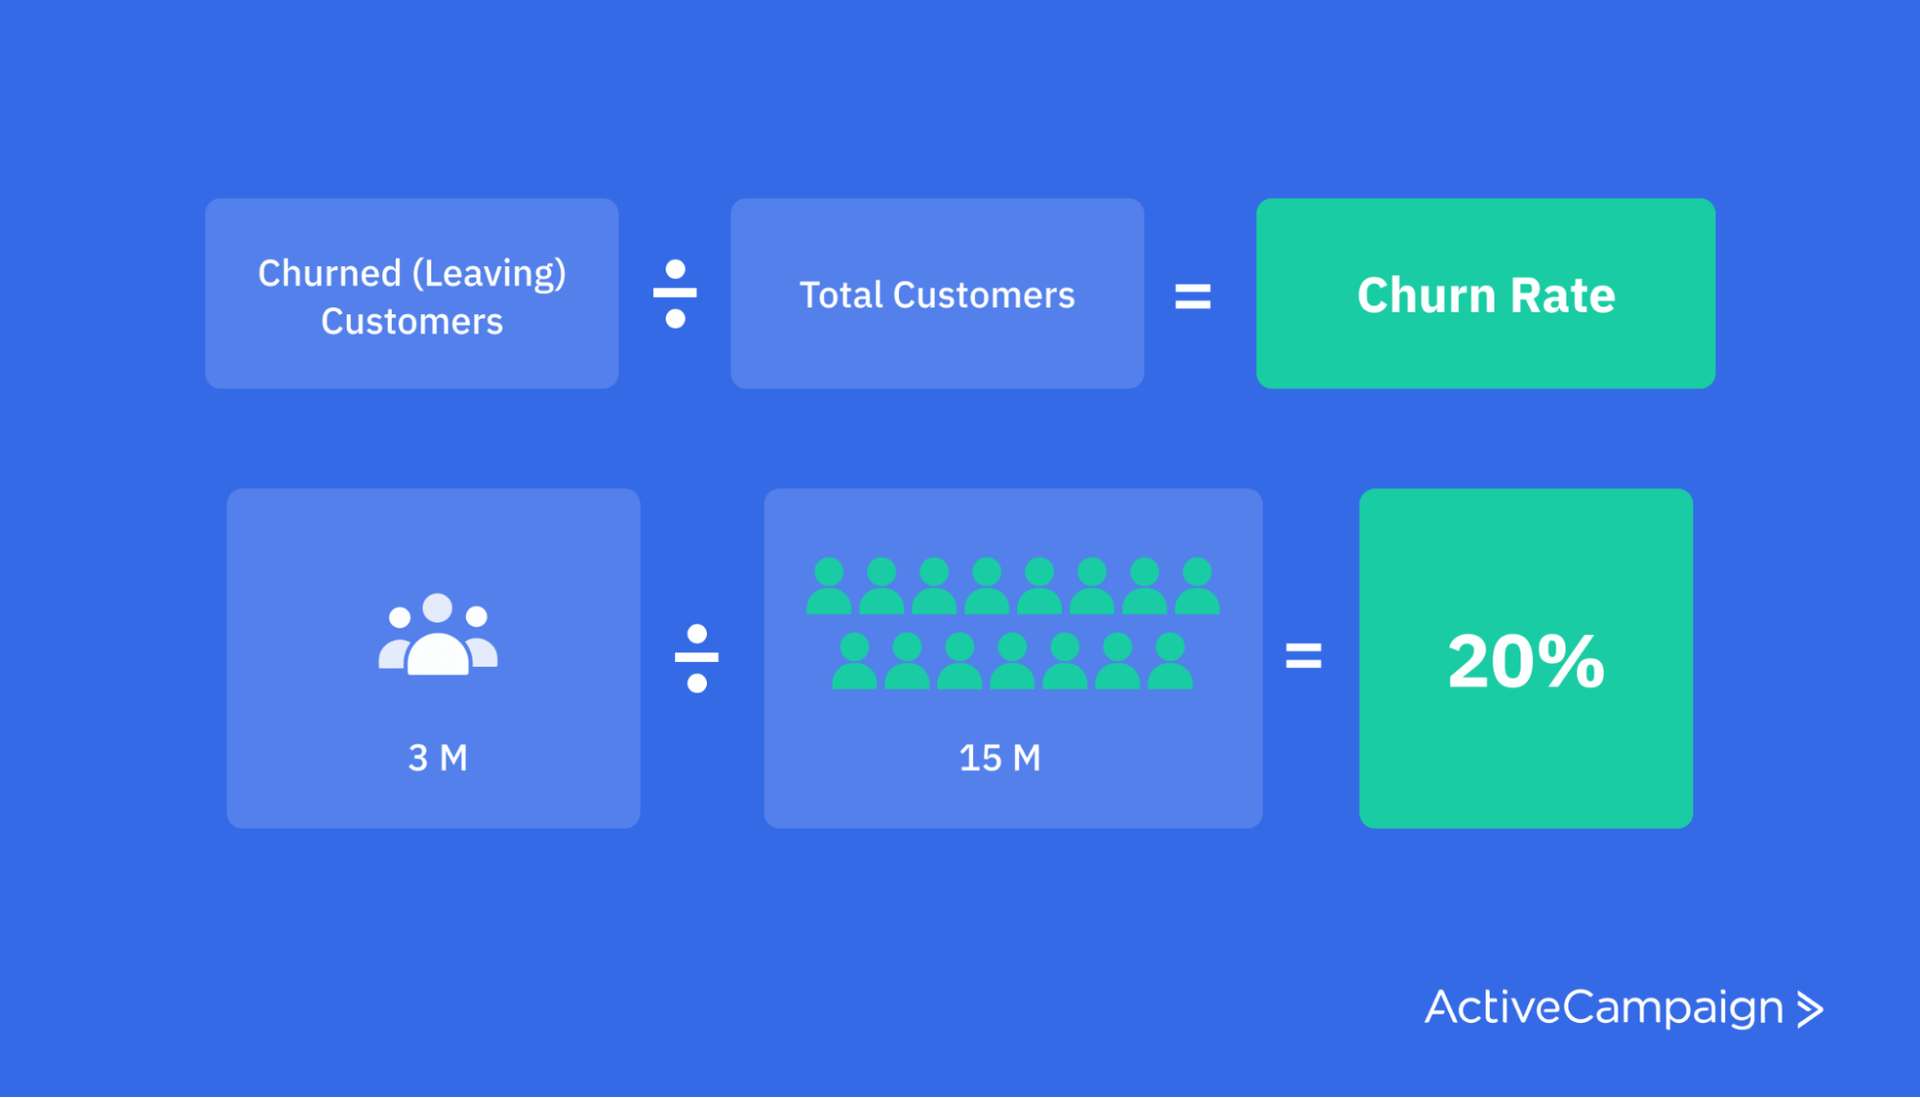
11. Churn rate
The dreaded churn.
This metric tells you how frequently customers leave. It’s the opposite of your retention rate. To calculate churn rate, divide the number of churned customers by your total number of customers.
Two of the most popular reasons customers churn are because they either feel like brands don’t care about them or experience bad customer service.
In 2020, the industries in the U.S. where customers were most likely to leave their current providers due to bad customer service were cable television (25% churn rate), financial/credit (25%), general retail (24%), and online retail (22%).
A CRM helps you look after your customers’ interests and make them see that you do care about them.
Track customer interests, activity, and interactions, then use that information to:
- Send personalized emails based on previous purchases
- Ask for customer feedback
- Reward customers for hitting certain milestones
The more appreciated and listened to your customers feel, the more likely they will stick around.
Another way to lower churn with your CRM is to look at accounts that have churned in the past. What do they all have in common? Keep an eye on indicators that a customer might churn, then work with at-risk accounts before it’s too late.
12. Average time to resolution
The right CRM system should lighten the team’s workload and help them serve customers more efficiently.
Average time to resolution: How long does it take your customer service team to resolve the average support ticket after it’s been opened?
(Pro-tip: Measure this metric in business days or hours, so off-hours are not factored in.)
Look at your overall average time to resolution, then drill down to a rep-by-rep level. If certain reps take way longer than others to resolve tickets, make sure they have the right tools and training they need. Analyzing this metric can help determine where certain reps might be struggling.
If your CRM works (and your team knows how to use it), the average time to resolution should decrease. We’ll get into the “why” in just a minute.
13. Average number of follow-ups per ticket
Lucky number 13. How many callbacks or emails does it take for the average issue to be resolved?
This dives a little deeper than the average time to resolution. It doesn’t consider how quickly the rep or customer replies. Instead, it measures how effective the responses are.
How can CRM help you lower these 2 metrics?
Make sure your support team gives customers the most relevant and tailored info the first time around.
CRM software makes it easy to see everything about your customer—behavior, preferences, activity, previous support tickets—in 1 place. Use it! Incorporate this information into the solutions you offer customers. The more background your customer service team has, the better (and faster) they can help your customers solve their issues.
Run the right CRM reports to measure success
Use these CRM metrics as a starting point—but don’t feel pressured to use all of them. Choose the KPIs that measure the things you want to improve.
Your KPIs should tie closely to the goals you set as part of your CRM strategy—why did you originally put this new CRM system in place? Make sure you’re measuring how well you’re meeting those original needs. (If you set SMART goals, you’re already halfway there.)
Once you know what you want to measure, you need to figure out how to measure it. Many CRMs offer built-in reporting that lets you track the same sales, marketing, and customer service metrics we just ran through.
Here are 4 popular CRM reports you can run to measure some of your chosen metrics.
Sales forecast report
A sales forecast report uses your lead data and sales trends to predict future revenue.
With ActiveCampaign, you can use win probability to take revenue prediction 1 step further.
Win probability uses machine learning to analyze hundreds of factors, then predicts how likely you are to close a certain deal.
Win probability helps you determine which actions lead to closed deals and which are unimportant.
Sales conversion report
This report tells you what percentage of leads convert within a specific date range—aka your close rate.
You can break this report down by lead source to see where these leads came from. Do more inbound leads close vs. outbound leads? What about leads from social media vs. organic search?
This report has the answers.
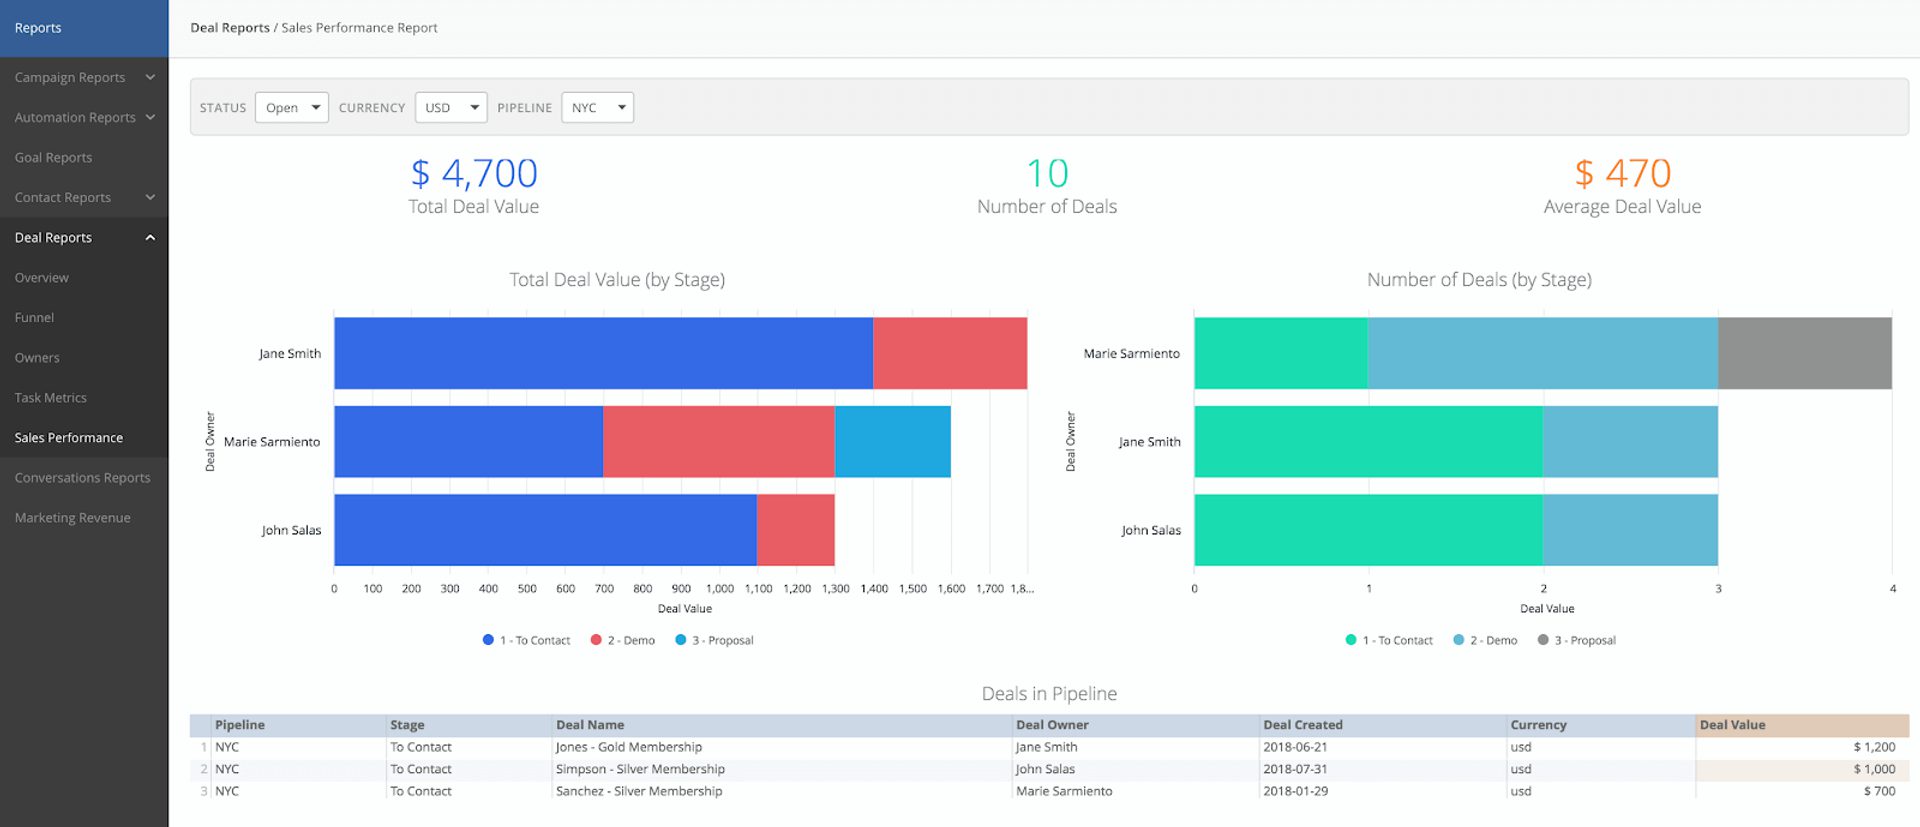
Sales performance report
A sales performance report gives you a leaderboard view of your sales team’s current and historical performance.
In ActiveCampaign’s Deals CRM, you can view:
- Sales performance metrics, including total deal value, total number of deals, and average deal value
- Bar graphs depicting the deal value by stage and number of deals for each sales representative on your team
- A table of each deal in a pipeline with the deal owner and deal value
- Deals sorted by Deal Status (Open, Won, or Lost), Currency, or Pipeline
Lost deals report
Analyzing your wins feels great, but don’t forget to learn from your losses, too. Knowing why someone said ‘no’ to your business can be even more important than knowing why someone else said ‘yes.’
A lost deals report shows you which deals your team didn’t close—and why. Use this report to:
- Find common reasons that leads fail to close
- Figure out how to handle those objections from other leads as they come down the pipeline
Track All Your CRM Metrics
FAQ
What is the difference between CRM and ERP?
ERP stands for Enterprise Resource Planning and is mainly used to manage day-to-day activities such as accounting, supply chain management, risk management, etc. While a CRM focuses on customer data and primarily used by the sales and customer service departments, an ERP focuses on financial data. It is used primarily by the finance and purchasing departments.
Both the ERP and CRM systems are essential for most companies. Together, they create far greater efficiency and help leaders make better decisions—within sales, finance, support, and other areas. The improved visibility creates a more streamlined workflow and helps your bottom line.
How do I know if my company needs a CRM?
While a CRM is extremely useful for almost any business—regardless of whether it’s a small, medium, or large company—not every business needs it right from the get-go. There are some warning signs that you can look out for that’ll show you whether your company needs a CRM right now or if you don’t need it yet.
Here are some of the warning signs you should be looking out for:
- Bad collaboration between your business departments
- Poor data analysis
- Low efficiency and business productivity
- Low levels of customer satisfaction
- Low retention rates
- Rapid business growth and declines
- Missed sales opportunities
If your business is struggling with 1 or more of these points, you should consider investing in a CRM platform, complete with a CRM database, sales and service features, and automation options.
What is a customer loyalty ladder?
A customer ladder divides your customers based on their level of engagement with your business. There are 4 different levels, including lead, customer, client, and advocate. The hope is that these customers will move their way up your customer loyalty ladder until they eventually become avid, long-term supporters of your business.
Your CRM system can help you achieve this by providing excellent customer service and ensuring that customer needs are met at each stage of your business.
The (success) story is in the data
“Data, I think, is 1 of the most powerful mechanisms for telling stories. I take a huge pile of data and I try to get it to tell stories.” -Steven Levitt, Co-author of Freakonomics
Measuring the right metrics can be the difference between a success story and a cautionary tale. If you know how to measure your CRM success, you can keep track of how close you are to reaching your goals.
If you find yourself off-track, be willing to test different ways of using CRM to meet your business goals. Try something new, measure the results, rinse, and repeat. You got this!
Want to learn more about how to leverage your CRM for your advertising campaigns? Learn exactly what CRM advertising is and how you can use it in your business.