Your landing page is live! It’s had some time to get settled and start to accomplish its goals.
But has it?? How can you tell what kind of impact your landing page has on people?
Get out the ruler and measure.
Well, sort of. It’s more like: Get out your Google Analytics, it’s time to look at landing page metrics.
There’s no point of even having a landing page if you don’t know how to measure its performance.
Which landing page metrics matter the most? This post will show you:
- Which landing page metric is most important (plus 4 other landing page metrics to monitor)
- How to optimize your landing page to improve your metrics – and get great landing page results
What’s the most important landing page metric?
The most important landing page metric to track is conversion rate.
Let’s break down conversion rate basics and frequently asked questions.
What is a conversion rate?
The conversion rate, also known as the capture rate, is the percentage of users who take the desired action of your landing page. Desired actions can include:
- Buying a product
- Subscribing to a list
- Clicking on a link
Why should I care about conversion rates?
Tracking a landing page conversion rate helps you understand:
- If a landing page is performing well
- What parts of your landing page might need to be improved
- Whether it’s worth the time (and money) to keep using the page
Conversion rate is the landing page metric that prompts you to ask, “what works on this page, and what doesn’t?”
Conversion rate helps you learn about:
- What brings people to a page
- How people move through your site
- What actions they take
- What stops them from completing an action
What’s the average landing page conversion rate, and how do I calculate mine?
The average landing page conversion rate is approximately 2.35%.
- The top 25% of sites convert at 5.31% or higher
- The top 10% of sites convert at 11.45% and above
Is that a good conversion rate? Well, “good” is sort of relative, because:
- Conversion rates vary based on the intended landing page action
- Some industries have lower conversion rates than others
- Landing page conversion rates change based on the source of landing page traffic (PPC ads, email campaigns, social ads, etc.)
- Most businesses don't actually make their conversion data public (so the average is skewed)
You can use these benchmarks as goals – but it will probably be pretty easy to beat the average landing page conversion rate (there are a lot of bad landing pages out there). Instead, target the top 25% or 10%. Learn from the great landing pages and strive to make your landing pages one of them.

“It’s important to take stats like these with a grain of salt, because it’s hard to generalize about conversion rates.
For example, a free trial landing page is naturally going to have a higher conversion rate than a paid product or subscription.
I would say that stats like these can be useful for a general idea of what's good and a way to see what kinds of things work on the types of landing pages you can try, but there’s no one definitive good conversion rate. Different landing page purposes and varying industries will show different conversion rates, but that doesn't make the rate per landing page bad.
One thing to keep in mind is that landing page metrics are directly impacted by the type of visitors you’re bringing in. if you’re not targeting effectively, then no matter how great the page is, your conversion and bounce rate will be impacted”
To calculate the conversion rate, divide the number of conversions completed actions) by the total number of visitors, then multiply the result by 100 to get a percentage.

Who knew math could be simple? Conversion is the goal of almost any landing page. That’s why it’s the most important metric. (Source: Hotjar)
How to measure landing page success: 4 landing page metrics to track
If the conversion rate is the main course (like the most important metric), these 4 other metrics are the side dishes.
A great conversion rate doesn’t appear from thin air. You can use 4 other metrics to understand what’s happening on your landing page – and optimize to improve your conversion rate.
The 4 other landing page metrics are:
- Bounce rate
- Pageviews
- Time spent on page
- Sessions by source
Do you want to see all of this data in one organized place? You can create a customized data visualization graph with the Venngage Graph-Maker tool.
1. Bounce rate
“Let’s bounce.”
In addition to being a fun slang term for leaving, bouncing – as in bounce rate – is a landing page metric you should track.
Google Analytics defines bounce rate as the number of “single-page sessions divided by the number of total sessions.” In human speak, it’s the percentage of all users who leave after they view a single page. A low bounce rate is usually better than a high bounce rate.
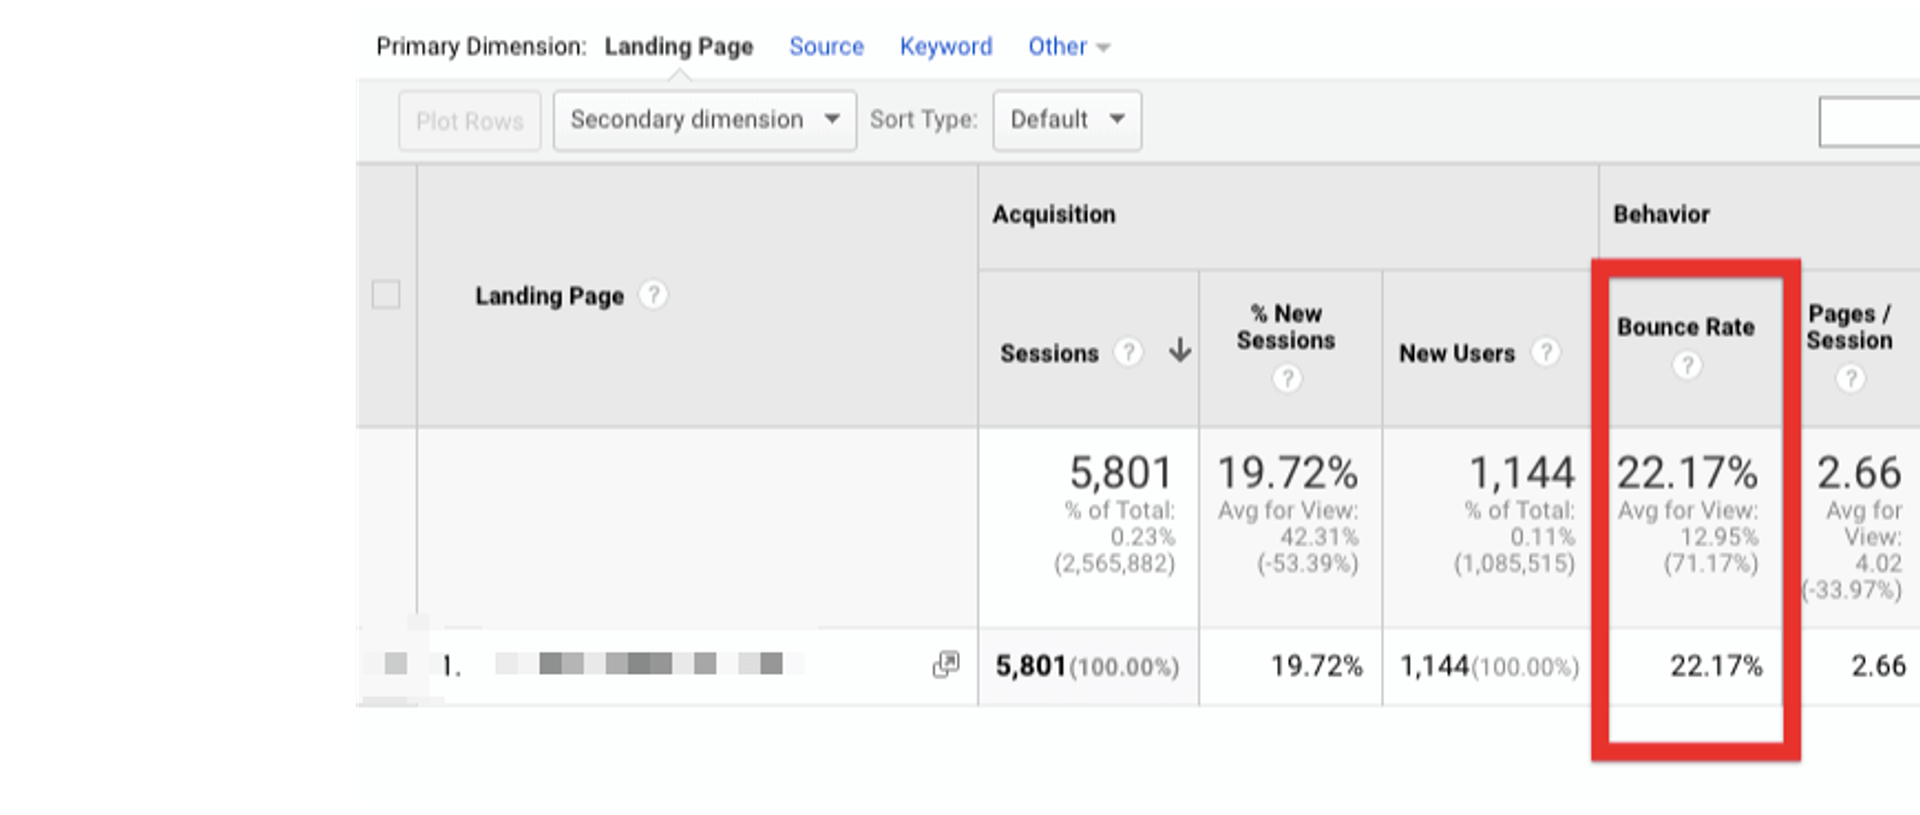
You can find the bounce rate for landing pages when you change the primary dimension to “Landing Page” in the top left corner.
Why would people leave your page as quickly as they come to it like they’re rushing to leave the office on a Friday afternoon?
Well, it comes down to things like:
- Your landing page doesn’t deliver on the expected promise
- The landing page design is too different from the ad that brings them to the page
- They can’t find the call-to-action on your page
- They flat out don’t understand the point of the page
- They think it’s ugly (hey, it’s valid)
If you have a high bounce rate, that could mean your landing page content doesn’t meet your visitors’ expectations. If people don’t get what they expect from your landing page, they won’t take the action you want them to.
One important note about bounce rate – some recorded bounces are not what they seem.
Google Analytics calculates bounce rate as the percentage of sessions/(visits) where only one interaction occurs. Google measures this by the time of first arrival of a visitor, and if there isn't a second interaction within 30 minutes –- it counts as "a Bounce".
But what if a visitor actually found your content useful? Suppose they scrolled down the page and read your content for 15 minutes, or clicked over to your product tab. That’s engagement, not a bounce.
But if Google doesn't see a second interaction within 30 minutes of the visitor arriving they call it a bounce anyway. Good news – if you reconfigure Google Analytics and Google Tag Manager to track bounces differently, your bounce rate data will be more accurate and more useful.
2. Pageviews
Pageviews tell you how many times your landing page has been viewed. .
Pageviews can give you a sense of how many people come to your landing page. That’s important because:
- You can filter by date, to see if seasonality (or weekend/weekday) has an affect on your visitors
- You can see which pages get more traffic, which can help you decide what to optimize
- You can play detective on pages with low conversion rates – are the traffic sources to this page sending you the type of visitor that’s likely to convert?
Pageviews aren’t the goal – customers are the goal. But looking at pageviews might help you understand why people aren’t becoming customers.
Google Analytics can’t tell you why there are spikes on different days, but when pageviews spike, it’s a good time to look at other marketing campaigns (email, social media, PPC, etc.) to see what might cause increases.
3. Time spent on page
Time spent on a landing page can be a useful metric to track, but it’s important to note that you should take it with a grain of salt.
The type of landing page you have can have an effect on how long people stay on it.
A longer (or shorter) time on the page doesn’t necessarily indicate that it’s a good or bad landing page. However, you can still use it to decide whether changes need to be made.
Let’s say you have an educational landing page to explain a new feature. If visitors spend a short amount of time on your page, it can mean that something is confusing, or that there isn’t enough relevant info there so they went looking for it somewhere else.
If your average time on page is very low, you may want to consider updates to your landing page content, like:
- Copy changes
- Including more resources
- Adding images
However, time on a page has a caveat. Since Google records an interaction as a bounce if there’s less than 2 interactions in 30 minutes, that means the time spent on the page won’t be recorded if it’s called a bounce.
Luckily, there’s a fix! It’s a partnership between User Timings API and Custom Metrics.
From the moment a tab is open, the clock is running. Sometimes, multiple open tabs and forgotten pages can affect that average time in Google Analytics (until the default session timeout of 30 minutes). In most cases, the total time on page isn’t even recorded because users close their browser window or the session times out.
This is where the User Timings API and Custom Metrics in Google Analytics can make your time spent on page metrics valuable. It helps you track page visibility between visible, active windows and hidden ones (like switching between tabs).
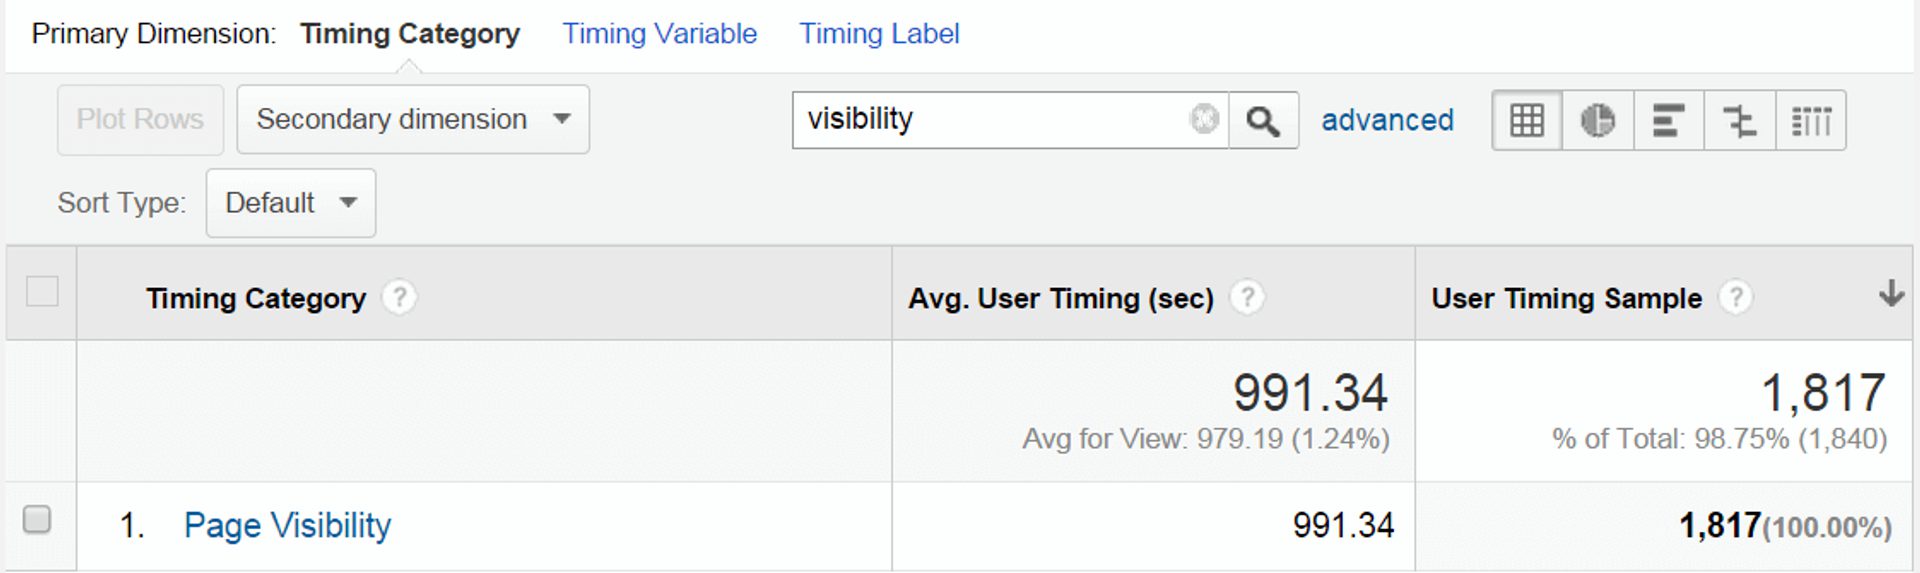
With this tool, you can create timestamps to show when someone moves away from a page (like going to a new tab) or closes the browser window entirely.
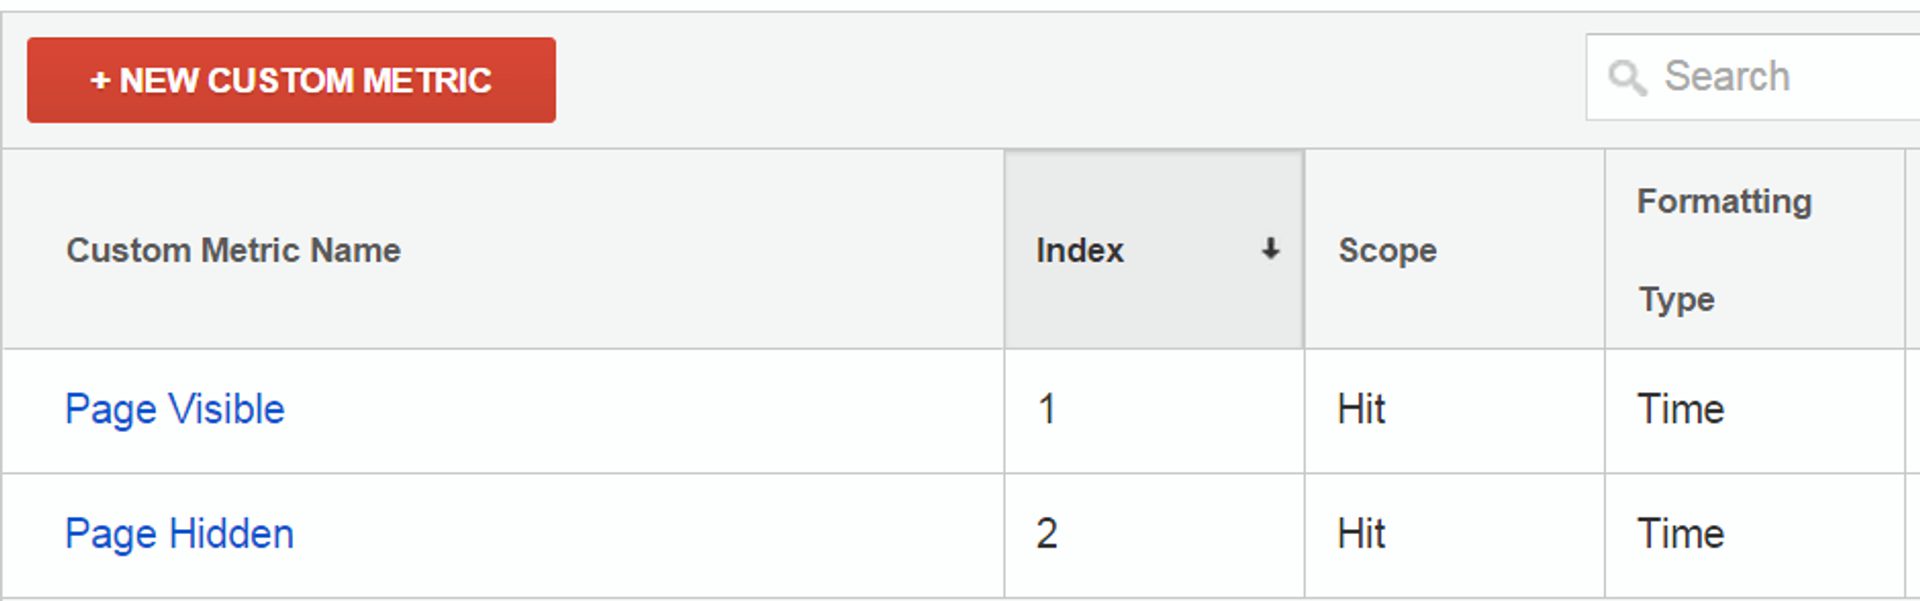
Between the API and Custom Metrics, you can create categories to more accurately calculate time spent on a page.
4. Users by source
Where is your landing page traffic coming from? Does one source lead to higher-converting traffic than another?
The users by source metric tells you which channels all of your traffic comes from. It’s not enough to just know that you get traffic – it’s important to know where it comes from.
Why?
This landing page metric can tell you what traffic sources need to be improved. If your paid ads traffic is through the roof but you can’t even see your organic search traffic with a microscope, it might be time to take a second look at your page.
“How do I find landing page metrics in Google Analytics?”
Google Analytics is one of the best metrics tools out there. It gives a lot of useful info – especially for small businesses who don’t need super deep insights – and it’s free (win-win).
Here’s how to easily find all of these metrics in Google Analytics:
Here’s what you just watched:
Acquisition > All Traffic > Channels > change the primary dimension to Landing Page.
Easy as pie.
“I think the most important part of measuring landing page performance is to do it continuously. It isn’t a one and done exercise – establishing baselines and measuring performance as you make changes, build out new pages, and change your marketing spend will give you the best read on what’s happening and let you to iterate improvements.” – Justine BaMaung
Conclusion: How to optimize your landing page
You’re about to feel 3 things – happy, stressed, and relieved. Why?
These 3 reasons:
- Targeting your pages correctly can increase conversion up to 300% (Woohoo!)
- You only have 8 seconds to make an impression on a landing page (Oh God, that’s it??)
- This section tells you exactly how to optimize your landing page and make the most of those 8 seconds to get that conversion increase (PHEW)
For the best metrics, include these 4 things on your landing page:
- Images
- Scrollable design
- Colors
- CTA Button
Images
The human brain processes images 60,000 times faster than text. That means the first thing your prospects see on a landing page are color and images.
Images on your landing page:
- Break up text
- Promote your product
- Direct attention to a CTA or key message
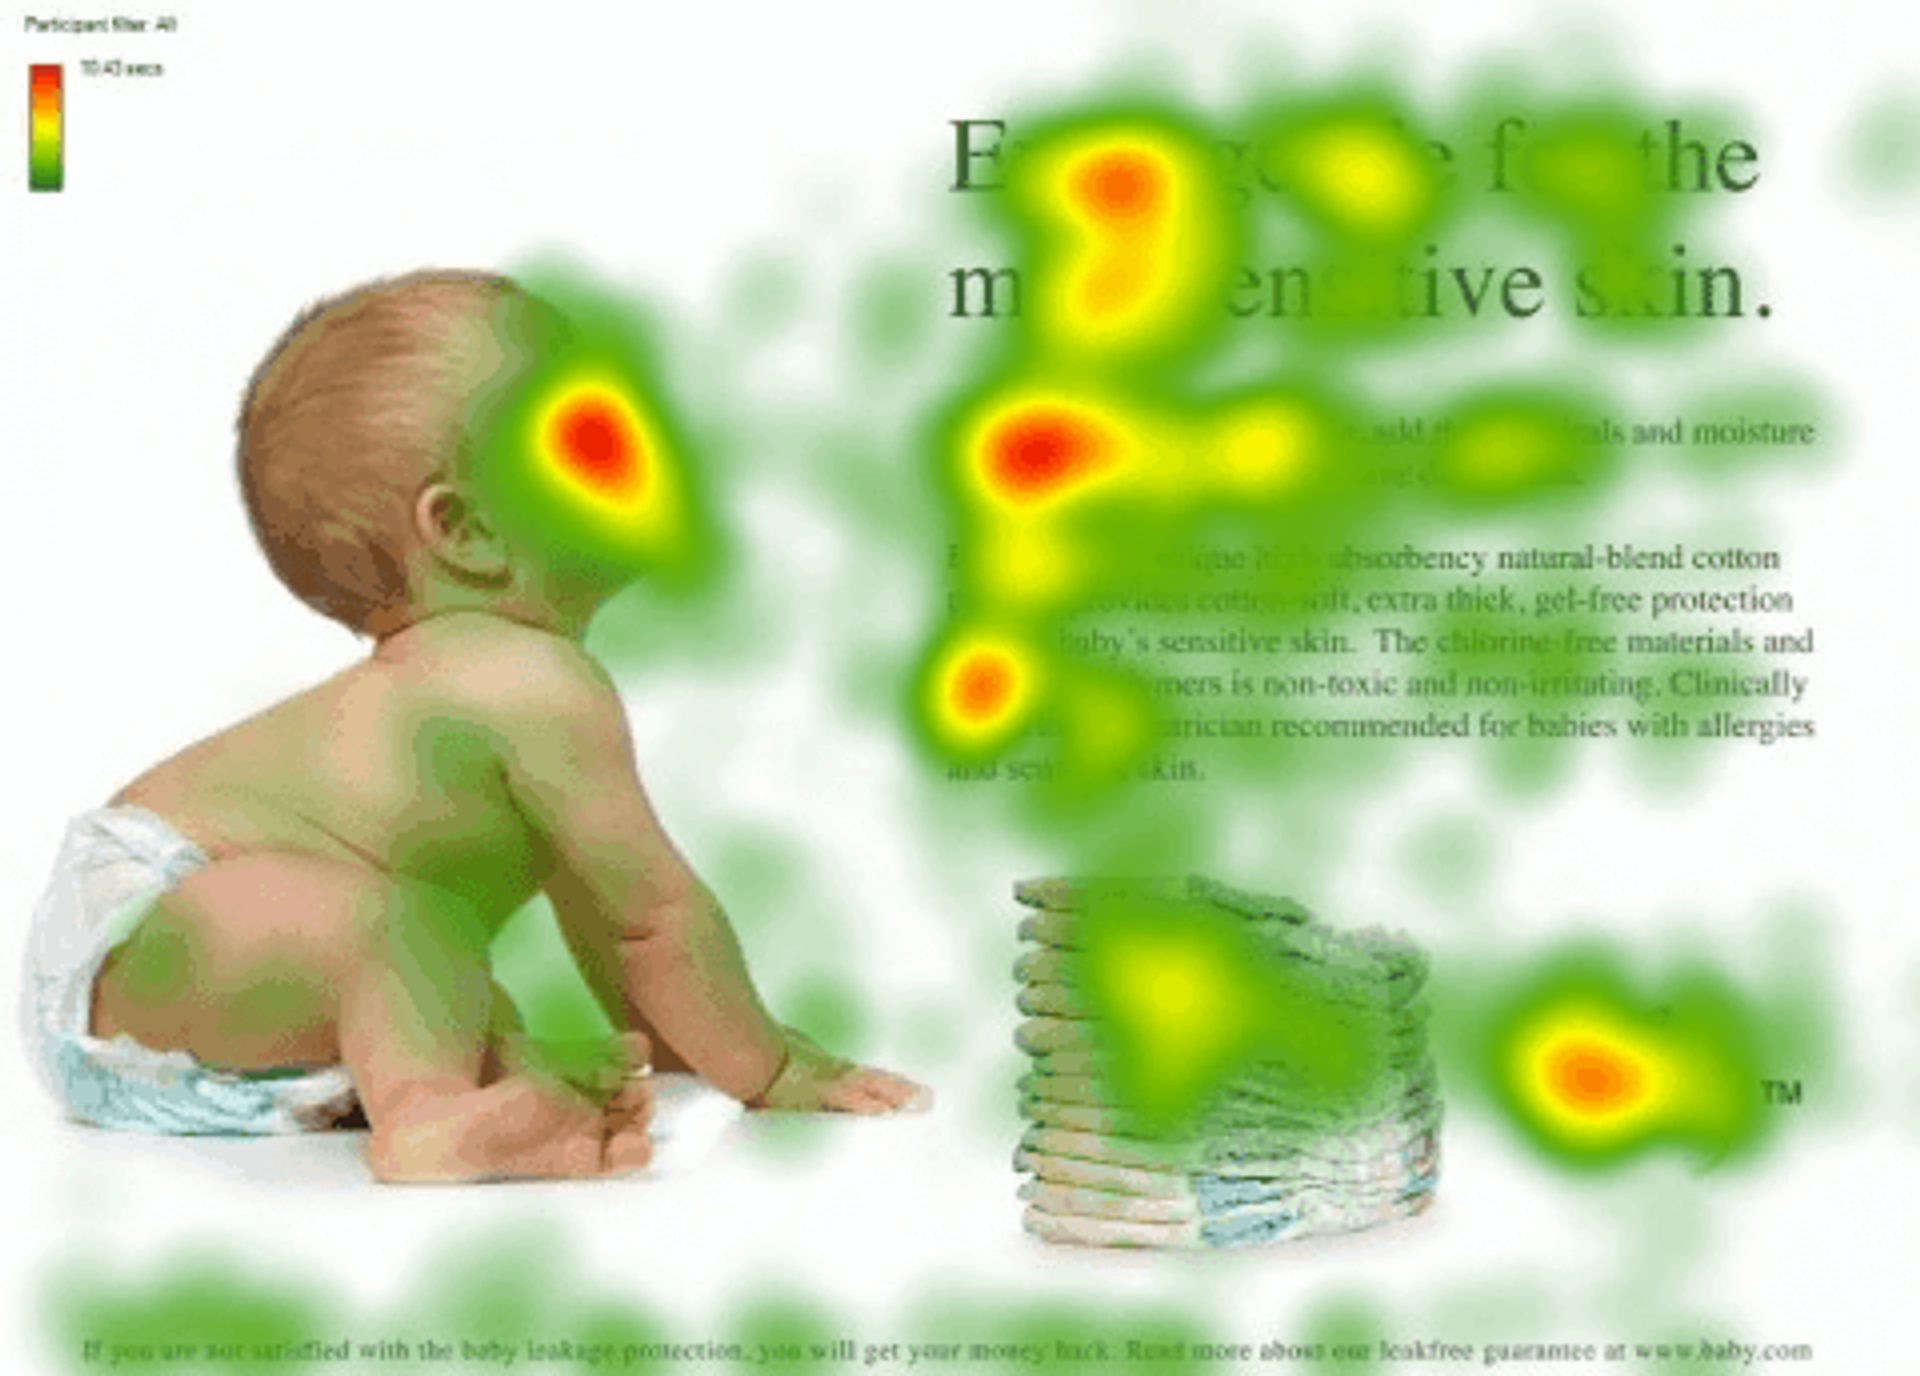
An image of the baby looking towards the text instead of facing forward creates a direction cue to a web visitor. (Source)
2. Scrollable design
People should be able to scroll through your landing page and easily find what they’re looking for.
One way to do this is to simplify your text and break it up into small sections.
The ActiveCampaign Predictive Sending landing page is a good example of this.
The top section tells you exactly what the feature does for you, and the bottom section tells you exactly how to do it. No room for error!
3. Colors
Who doesn’t love a little pop of color? But did you know that colors have a psychological effect on people?
“Color psychology is the study of hues as a determinant of human behavior. Color influences perceptions that are not obvious, such as the taste of food… Color can indeed influence a person; however, it is important to remember that these effects differ between people. ” – via the color psychology insights of Talia Wolf
Colors bring out emotional responses in people. Use your brand colors strategically on your landing page to encourage more conversions.
Proof that color works exists: Learn about how Marketing Donut saw a 21% increase in conversions by creating a color contrast with their CTA button.
4. CTA
Your landing page needs something attention-grabbing and actionable that reflects its goal.
Say the purpose of your landing page is to get someone to fill out a form and download an ebook. If your CTA button says “Click Here,” it won’t resonate. “Click Here” is not the actual action you want someone to complete.
Instead, make your CTA relevant to your desired outcome, like “Download my Ebook.”