Everyone wants to be data-driven in their marketing and sales process. This is a good goal. Understanding your data and applying that insight allows you to optimize your campaigns and drive more traffic, conversions, and sales.
Often, these “insights” come in the form of cause and effect: “When we do X, it results in Y. So let’s do more of X.” But many marketers don’t analyze the data deep enough and mistake correlation for causation.
And when you don’t understand the difference between correlation and causation, you can misinterpret your data and make misguided decisions. You can waste a lot of money and time on ineffective or even detrimental channels and tactics.
In this article, we’ll cover what correlation and causation are, how they differ, and explain how they affect marketing and sales. Finally, we’ll share some practical strategies to consistently tell correlation from causation in a business setting.
What is correlation vs. causation?
Let’s say you increased the number of sales emails you sent last quarter. You went from sending 1,000 emails per month to sending 3,000 per month. At the same time, your sales revenue increased. Does that mean that sending more emails caused you to make more sales?
Not exactly. We can see that there’s a connection, i.e., a correlation, between the 2 metrics. As 1 goes up, the other closely follows. However, we don’t have enough data to understand if that’s why the revenue increased.
What if the number of emails you sent increased because other marketing channels drove significantly more targeted leads, thus driving up the total number of sends? It could even be an outside factor, like increased brand recognition that drives both more leads and makes them easier to close.
This is why you need to know how to tell correlation from causation. Without that understanding, you can end up investing in the wrong areas of your campaigns. The definitions below will help you understand the qualities of each and how to distinguish them.
What is correlation?
Correlation simply means that there is a significant relationship between 2 variables. A variable is something you can measure—in marketing, think of things like revenue, traffic, social shares, the number of email campaigns, or ad spend.
The 2 variables in the example we introduced above are the number of emails sent and the sales revenue.
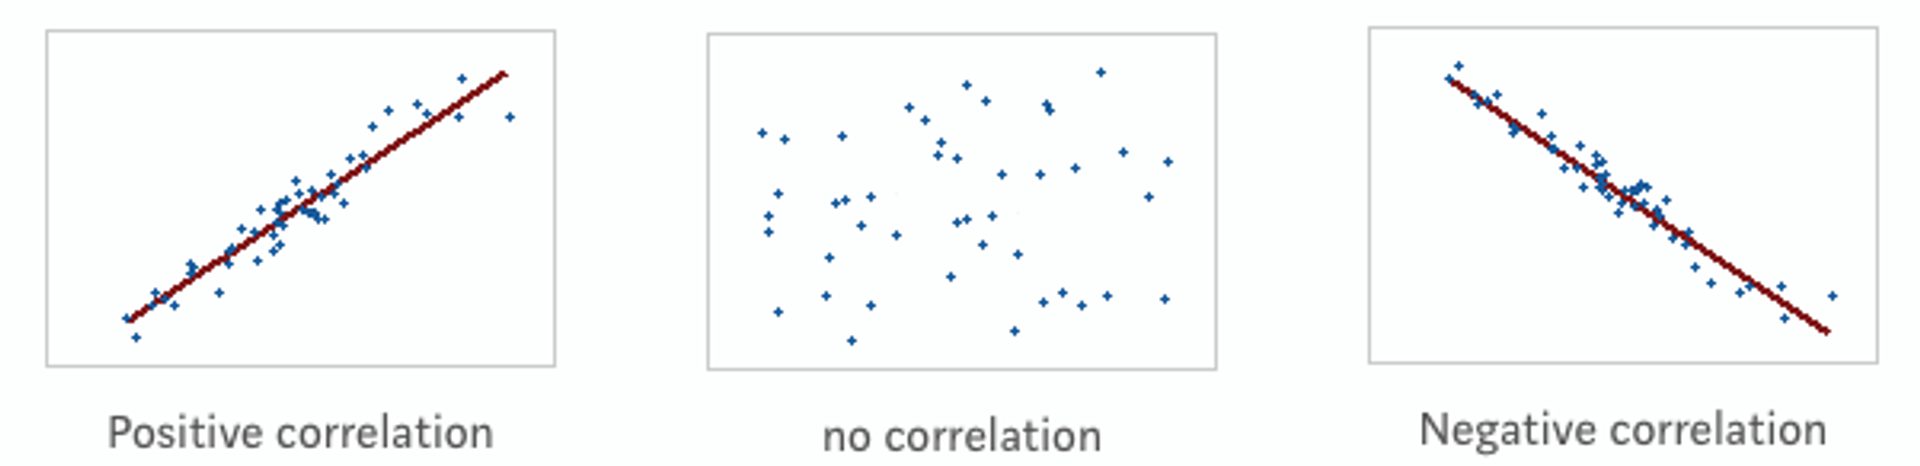
A correlation can be either positive or negative. A positive correlation is when both variables increase or decrease together. In other words, when 1 variable increases, so does the other, and when 1 variable decreases, the other does as well. If you chart points on a graph of these 2 variables, the points form an upward line.
A negative correlation is when the relationship shows that when 1 variable increases, the other decreases. If you chart points on a graph of these 2 variables, the points form a downward line.
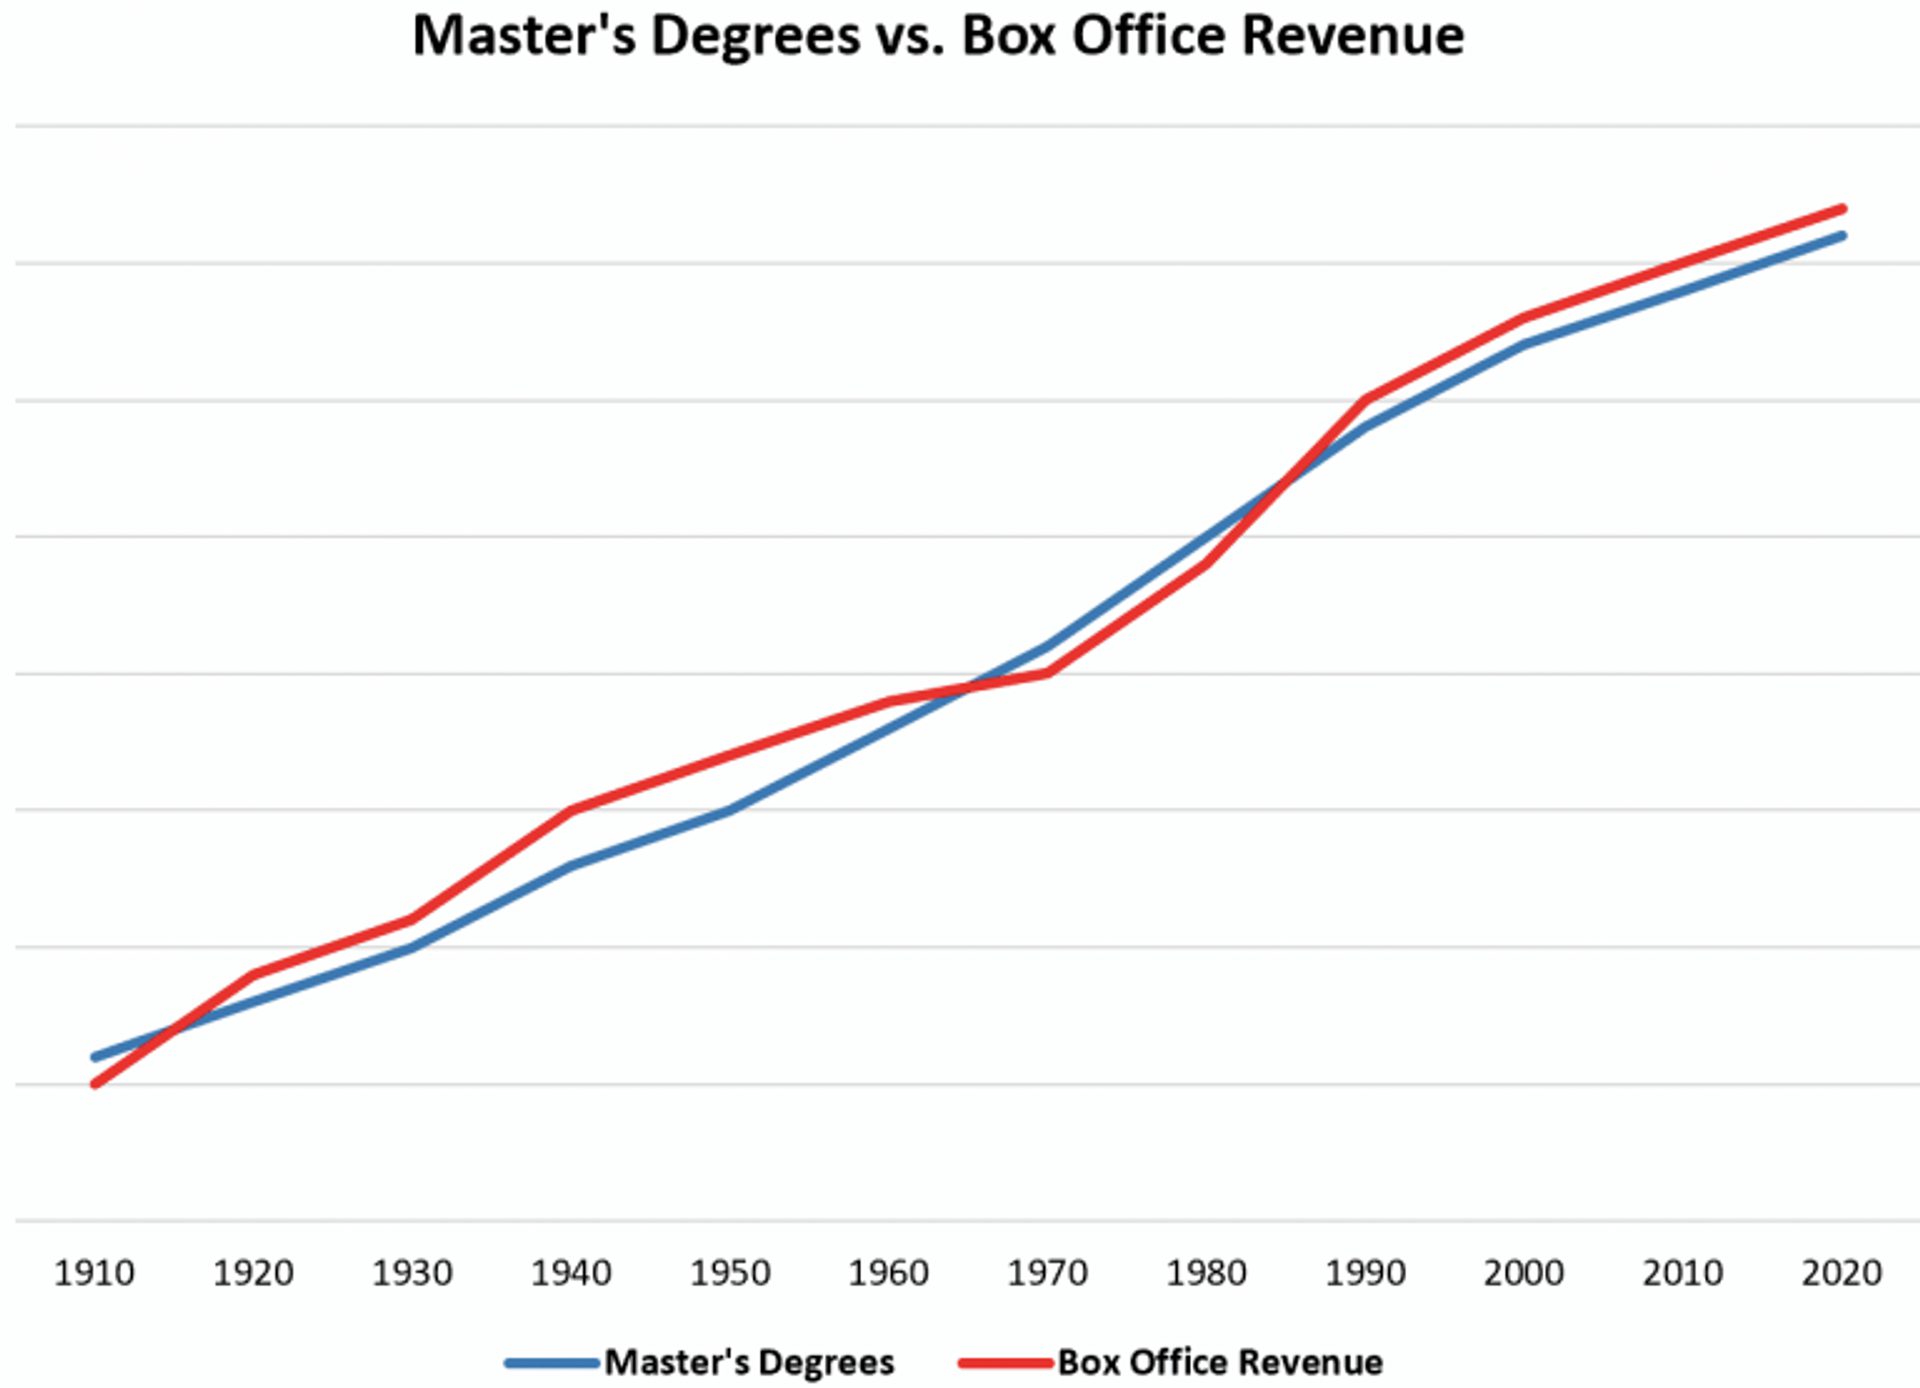
For example, over the past century, the number of people earning master’s degrees and the total box office revenue of the film industry have increased steadily. Both variables increased, so this is a positive correlation. Our example of emails and sales revenue is another example of a positive correlation.
For an example of a negative correlation, consider the sales of smartphones and the weekday circulation of newspapers. Since 2007, smartphone sales have increased while newspaper circulation has decreased.
What is causation?
Like correlation, causation is a relationship between 2 variables, but it’s a much more specific relationship. In a causal relationship, 1 of the variables causes what happens in the other variable.

A causal link can also be either positive or negative. In a positive causal link, the increase or decrease of 1 variable causes the same change in the affected variable. So if A increases, B increases. And if A decreases, B also decreases. For example, more rainfall will cause the local river’s water levels to rise.
In a negative causal link, the relationship is the opposite. If A increases, it causes B to decrease, or vice versa. For instance, more people driving into town and parking their cars will cause there to be fewer empty parking spaces.
Why does correlation not equal causation?
As we’ve covered, a correlation just means that there is some relationship between 2 variables. In contrast, causation means that the change in 1 variable is causing the change in the other. People often mistake the 2, assuming that because 2 variables have a relationship (whether positive or negative), 1 must have caused the other.

Marketers are especially guilty of this. “Look, we did X, and our sales increased!” Cue plowing time, effort, and resources into more of the same. Two months later, the team’s scratching their heads, wondering why their new campaign isn’t driving significant results.
In reality, there are many other reasons why 2 variables might exhibit a pattern in how they change. Understanding these reasons helps you avoid assuming causation when it’s really just a correlation.
Third variable (or confounding variable)
Instead of 1 of the 2 variables causing the change in the other, there may be a third variable that affects both. One classic example is that ice cream sales increase as rates of sunburn increase. Instead of assuming 1 causes the other, we should consider a third variable impacting both: the weather. Higher temperatures and more sunshine affect both ice cream sales and sunburn rates.
Directionality issues
The issue of directionality refers to when it is unclear whether variable A is causing variable B or if variable B is causing variable A. For example, are you drinking more coffee because you didn’t sleep well, or are you not sleeping well because you’ve been drinking more coffee?
This is a classic problem with marketing and sales, as each department will happily take the glory for an increase in revenue and drum up some metrics that seem to prove that “we did it.”
Chain reaction
Similar to the third variable issue, chain reactions are when 1 or more other variables act as an intermediary between A and B. Rather than A causing B, perhaps A is causing a change in variable C, and the change in C affects B. If you were to change something about variable C, the correlation between A and B might disappear.
How correlation vs. causation affects your business
Modern sales and marketing campaigns are data-driven, so you need to understand the patterns in data and what relationships they indicate. When you understand where correlation and causation show up in your business, you will be better prepared to identify each.
Correlation vs. causation in marketing
In any effective digital marketing campaign, you’re constantly making changes and adjustments on the fly. And with so many variables, it can be challenging to determine that 1 cause is having a particular effect. That doesn’t mean there isn’t something to learn, just that you have to be careful.
Email marketing is a huge component of digital marketing, and marketers often test lots of different ways to potentially improve results. You could change the subject line and see a better open rate. But what if that open rate is affected by the time of day, the day of the week, or even which type of subscribers saw the email that day?
That’s why it’s important to control other variables and test 1 thing at a time (and with enough volume to get a statistically significant result).
In the quest for improvement, it often feels like marketers don’t have time to be this exacting. In the next section, we’ll cover how to navigate this problem.
Correlation vs. causation in sales
Sales teams are also increasingly seeking to optimize their processes and practices with “big data.” Looking for outside factors that affect sales can also be key to planning and strategy.
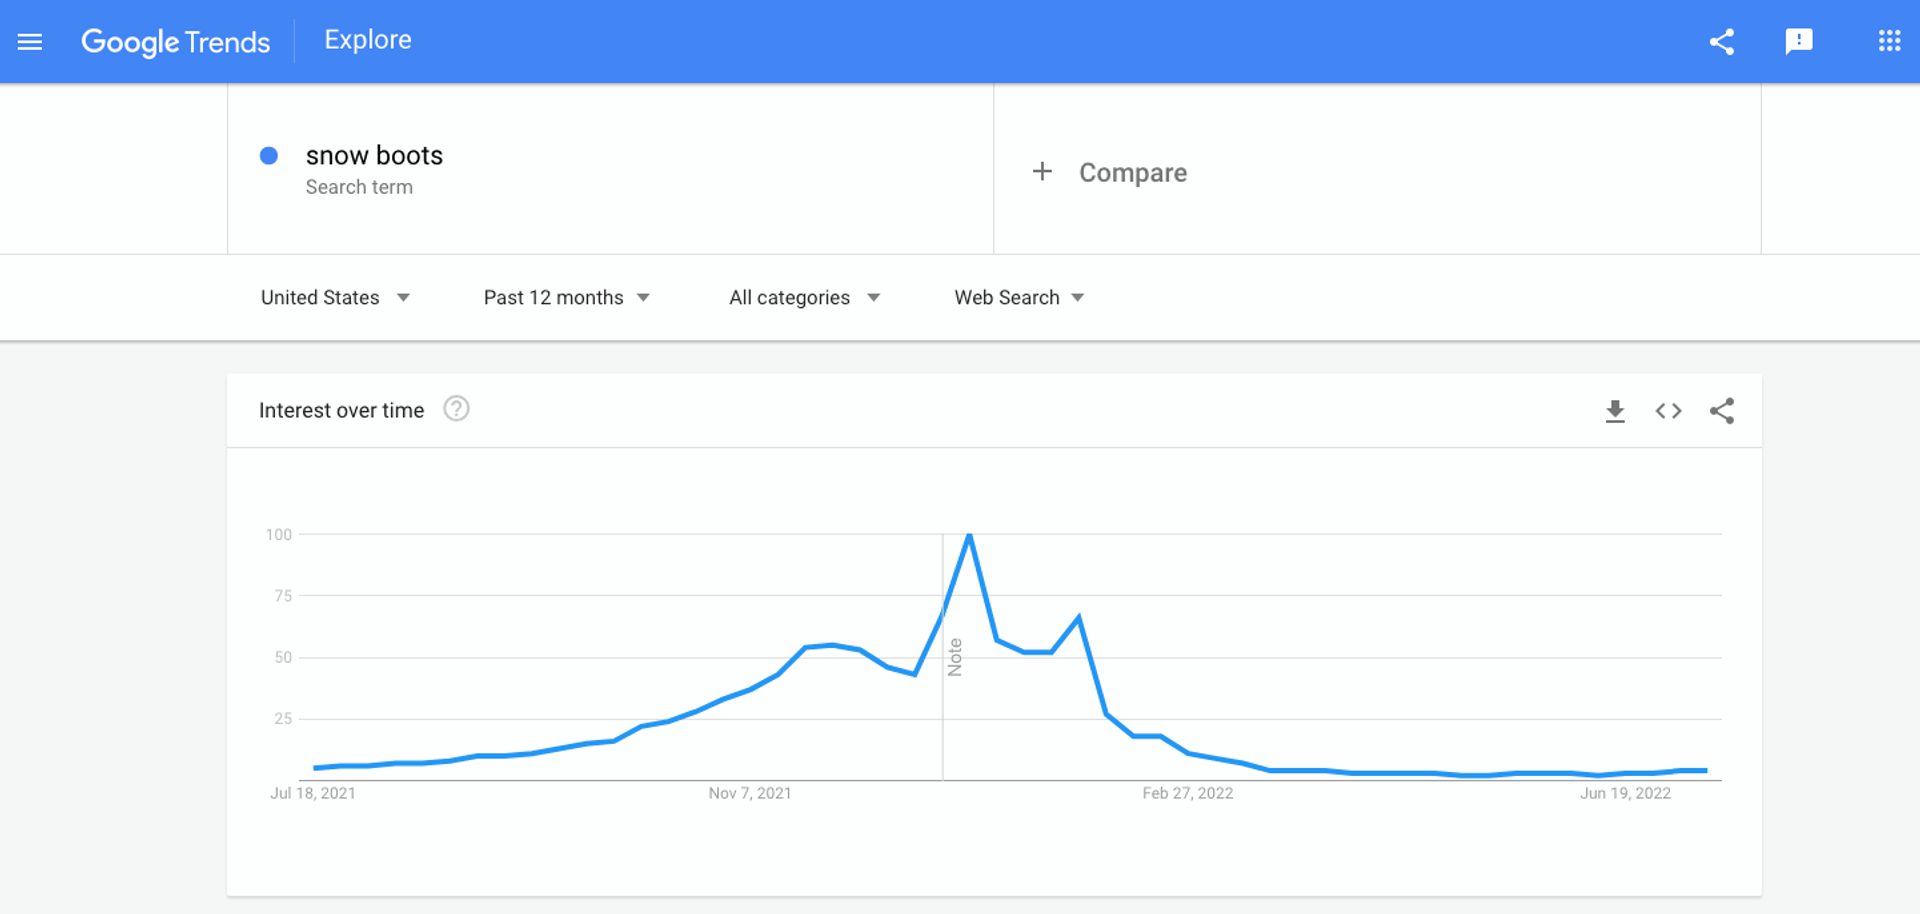
Consider when a pricing change seems related to a change in sales for a simple example of how correlation and causation can get fuzzy. Let’s say your company sells snow boots. Increasing costs force you to raise your prices. And sales increase month over month! It might seem like increasing prices caused sales to increase, but you have to consider other factors, like seasonality and whether your marketing and product availability have remained consistent.
Maybe around the time you had to raise prices, you also were able to get your snow boots in a new store. Or maybe, it's late fall, and the approaching winter means demand for snow boots has skyrocketed.
As in marketing, your sales results may be affected by various factors. While you should always be looking for ways to optimize the sales process, you should also remember that causation is difficult to prove, and assuming a cause-and-effect relationship could lead to false assumptions and bad decisions.
How to determine correlation or causation
Your business does not take place in a perfectly controlled laboratory environment. Some endless variables and conditions could be affecting your marketing and sales outcomes. But that doesn’t mean you can’t study your data to learn how to optimize your processes.
The best way to establish a cause-and-effect relationship is to change just 1 thing and see what happens. You can think of this as testing your hypothesis. A hypothesis just means what you think will happen if you make some change to a variable or condition.
For example, you might hypothesize that sending your monthly email newsletter earlier in the day will lead to a higher open rate. The variable you are changing is the time the email newsletter is sent. To get meaningful evidence that your hypothesis is correct, you must keep all the other variables constant: the subject line, the sender name, etc. If any other details are changed, you won’t be able to say that the send time affected the open rate conclusively. This is where A/B testing comes in.
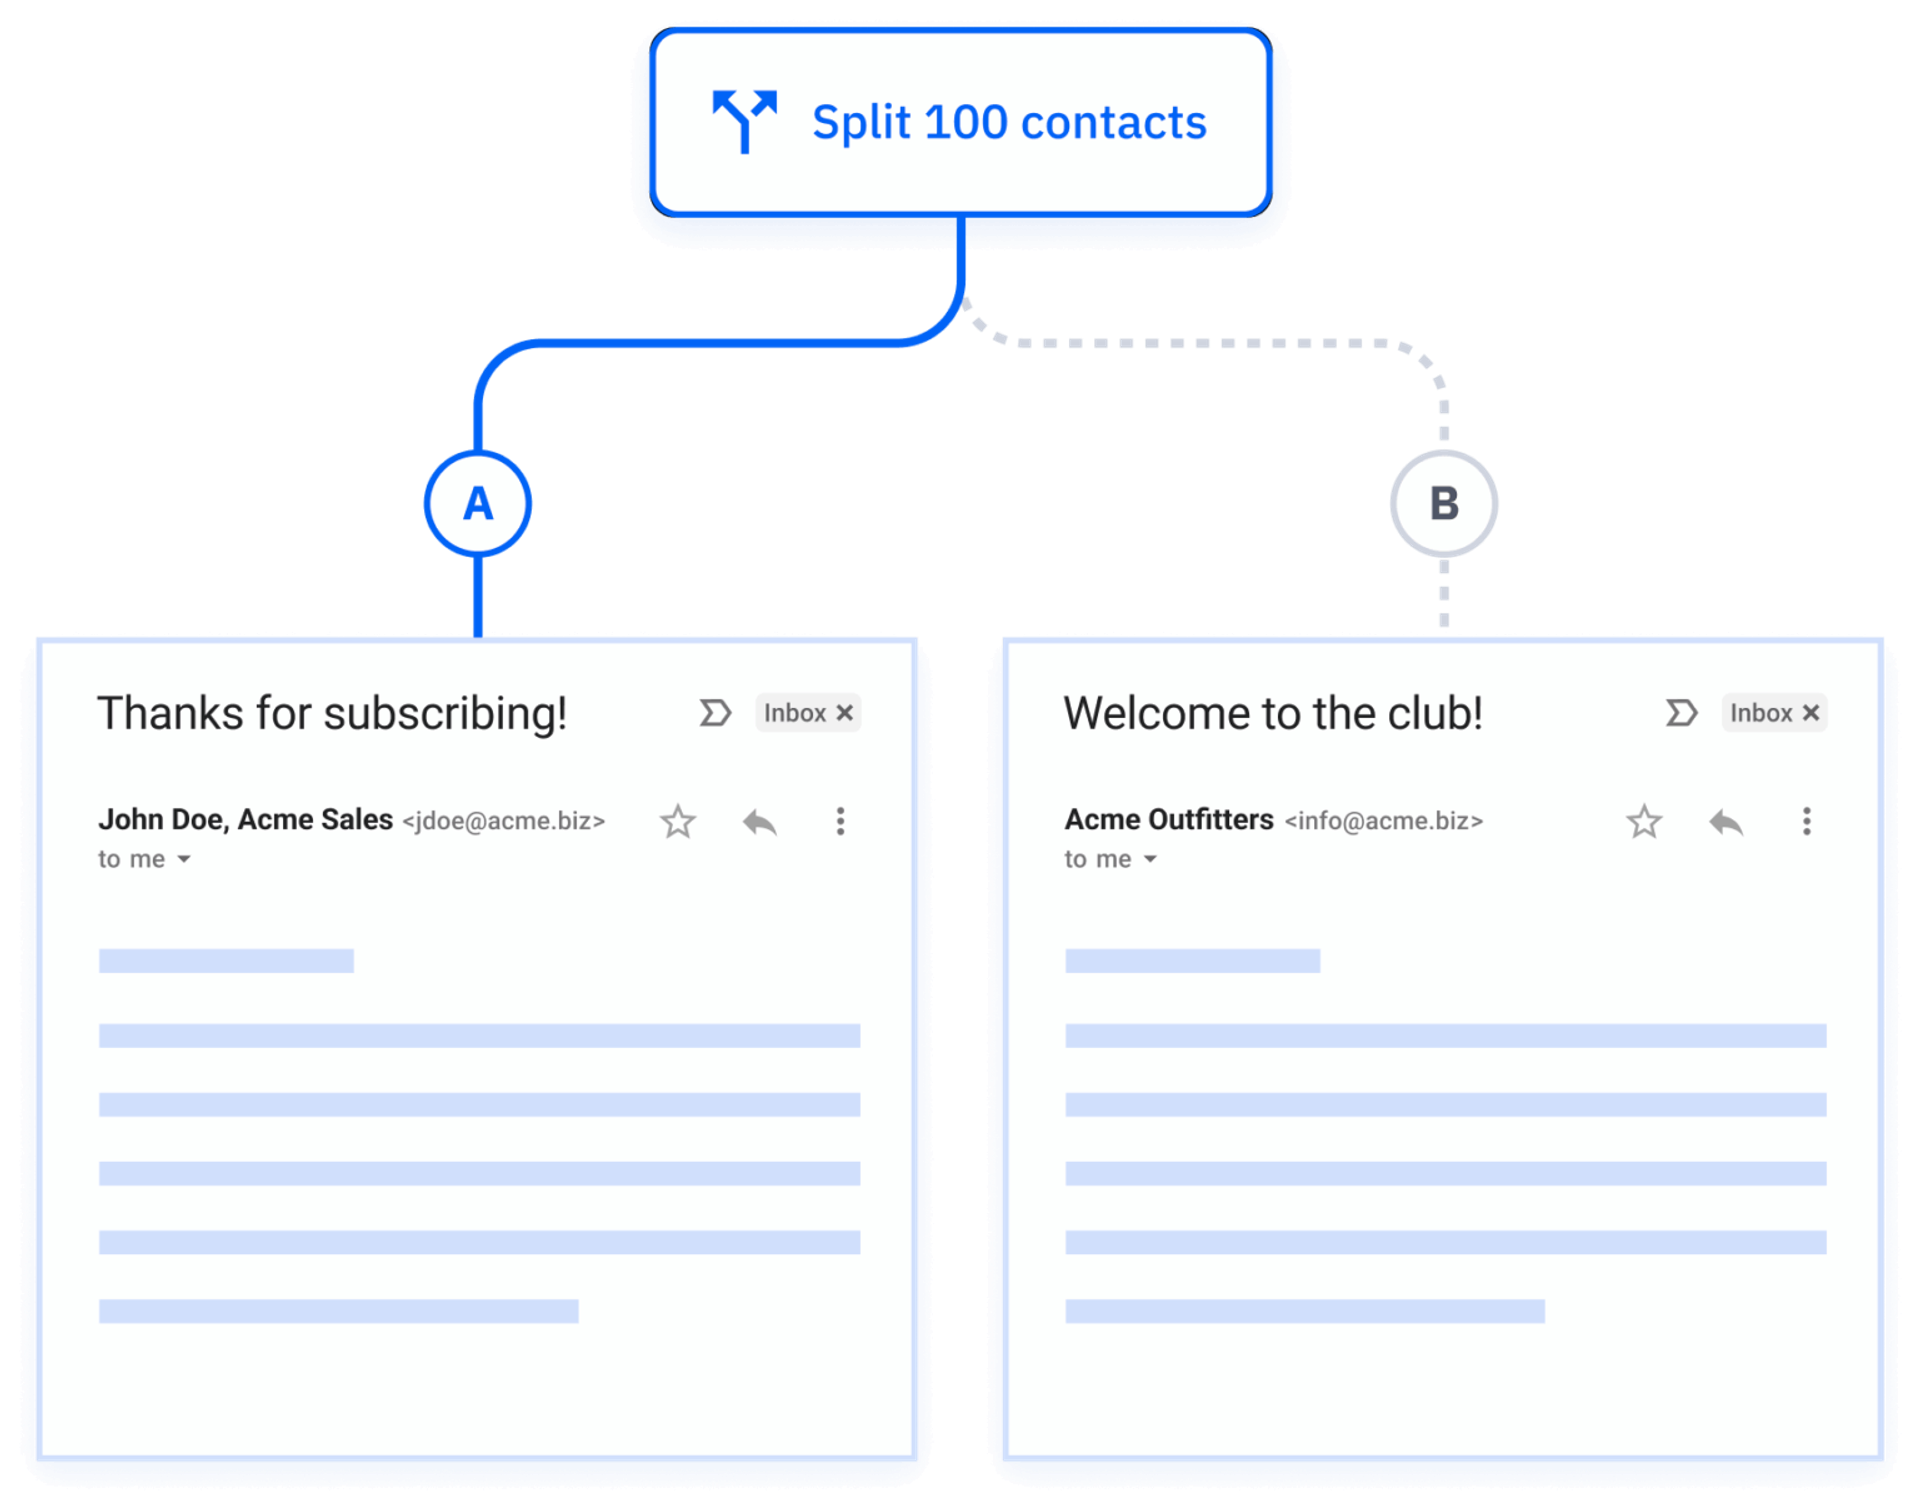
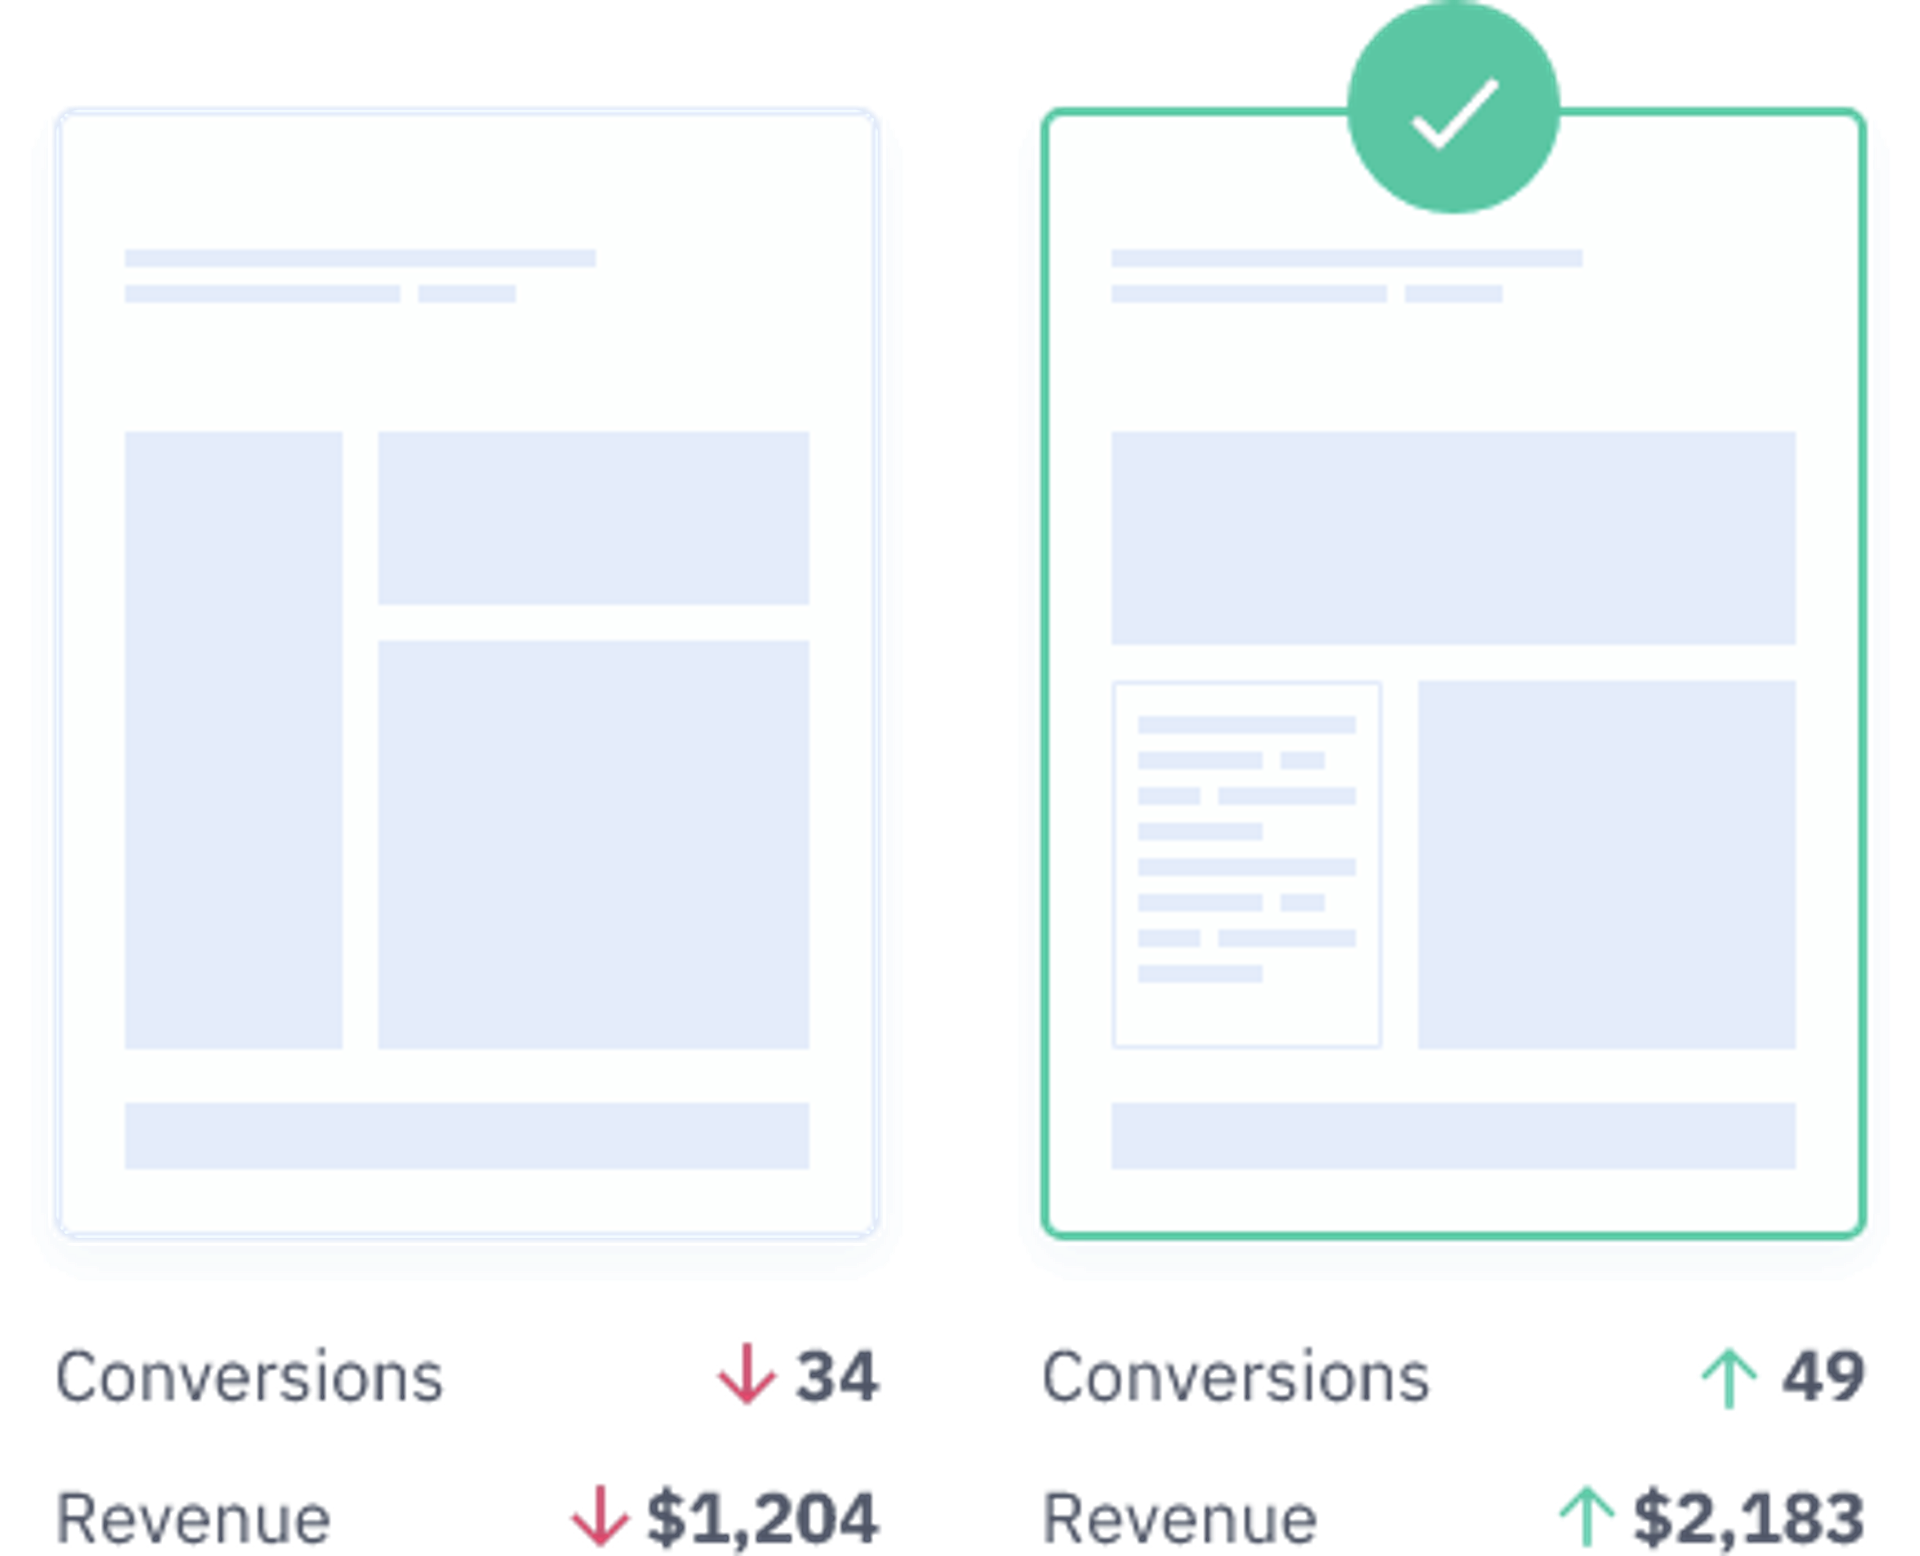
A/B testing allows you to change and test just 1 variable in your marketing or customer experience at a time. One of the most common uses of A/B testing is determining better email subject lines. You send the same email at the same time to 2 groups of people, with each group getting a different subject line. If there is a difference in the open rate or conversion rate, you can reasonably assume that the subject line was the cause (if there’s a statistically significant difference).
In situations where you don’t have as much control, you can still be on the lookout for correlation and causation. If you or a colleague believe you see a relationship between 2 things, ask yourselves:
- What evidence is there for a causal relationship?
- What other variables might be affecting the outcome?
- Could this be part of a chain reaction?
In a business setting, you may not always be able to distinguish correlation and causation accurately. Still, you can study your evidence, perform more experiments, and make informed decisions.
Better Understand Your Audience With A/B Testing
Frequently asked questions
Answers to some of the most common questions about correlation vs. causation.
How can you know if a relationship is causal or correlational?
Correlation is when there is an observable relationship between 2 variables. Causation is a specific relationship in which 1 variable causes a change in the other.
A carefully controlled experiment is ideal for determining causation. Keeping everything else the same, you would change the variable you think is the cause and observe to see if it creates a change in the variable you believe is affected.
If you can’t do such a controlled experiment, it’s a good idea to look for external factors that may be causing a correlation.
What is an example of causation?
Causation refers to 1 variable causing a change in another—for example, as the number of products in a shipping container increases, the weight of the container increases. The addition of products adds additional weight and therefore causes the weight of the container to increase.
What is an example of correlation but not causation?
The number of people buying calendars and the number of people joining gyms both increase around the beginning of the year. People are not joining a gym because they bought a calendar, nor are they buying a calendar because they joined a gym. Both variables are affected by the time of year and cultural norms.
Correlation does not imply causation
Everyone wants to work smarter. Everyone wants to make progress quickly. Those desires make it tempting to see relationships where you want them and assume cause and effect. In marketing and sales, this could lead you to waste time and resources on changes that don’t actually cause improvement.
The good news is that if you’re aware of the differences between correlation and causation, you can test and analyze your data to infer when changes are worth implementing. And with the ever-growing number of digital customer interactions, you can collect and learn from data more than ever before.
To get access to complete customer (and prospect) data and start leveraging A/B testing in your campaigns to fact-check your data-based hunches, access your free trial of ActiveCampaign.