It’s one thing to know there’s something wrong with your business’s online presence, but knowing what’s wrong and why is something else altogether.
For example, you might look at your key metrics and see that you aren’t hitting your sales or retention goals. You know something’s wrong, but in order to solve the problem, you need to zoom in and see what’s making potential customers leave. That’s where behavioral analytics comes in.
More and more businesses are moving into online and digital environments. While this can come with challenges, it gives companies much greater insight into how customers engage with them.
From email opens and clicks to time-on-page and more, there is a ton of data at your fingertips to help you pinpoint the exact moments that are pivotal to conversion.
Read on to learn what behavioral data and behavioral analytics are, how they can improve every step of the customer journey, and how you can get started.
Table of contents:
What is behavioral data?
Behavioral data is all the information about what your users do when interacting with your digital properties (websites, apps, files, etc.). This includes what users click on, how long they look at something, where they abandon a task, and much more. With the right technology, you can track all kinds of data and events.
Behavioral data is like the breadcrumbs users leave behind as they move through your digital properties. They help you see where users are going, what they’re doing, and what parts of the journey they struggle with. Each time a user scrolls, clicks, types, or leaves, it’s a clue to how you can improve their experience.

And with ecommerce sales expected to grow 50% in the next four years, the prevalence of behavioral data (and its value) will only increase.
Reply to difficult emails with confidence using our FREE email reply templates!
What is behavioral analytics?
Behavioral analytics is all about unlocking the value of behavioral data. It’s the collecting and studying of the breadcrumbs your users leave behind. You can use behavioral analytics to understand your customers better, identify roadblocks and barriers, experiment and optimize, and increase conversion rates, sales, and retention.
If this is all sounding very technical, try taking a step back. You probably use some form of behavioral analytics in your daily life. You (consciously and unconsciously) notice what people around you do and how they respond. You then analyze their behavior to learn how to work with them.
For example, let’s say you have a coworker who never responds to your emails. You’re not sure they even open them. Their behavior (not responding) tells you that you need to do something differently, so you send them an instant message, to which they are more likely to respond.
You just analyzed behavioral data to overcome a roadblock and reach your goal. Behavioral analytics is simply learning from people’s behavior.
Behavioral analytics vs. business analytics
Even if the term behavioral analytics is new to you, you may already be familiar with business analytics, which generally refers to the study of business outcomes, like deals won and revenue.
Business analytics tells you how your business is doing. Behavioral analytics is a tool to understand the “why” and “how” behind these results (and how to improve them).
Behavioral analytics helps you uncover and understand the journey your customers are on and where you are facing barriers or pushback. If business analytics tracks dollars and cents, behavioral analytics makes sense of how and why you are winning and losing those dollars.
Why is behavioral analytics important?
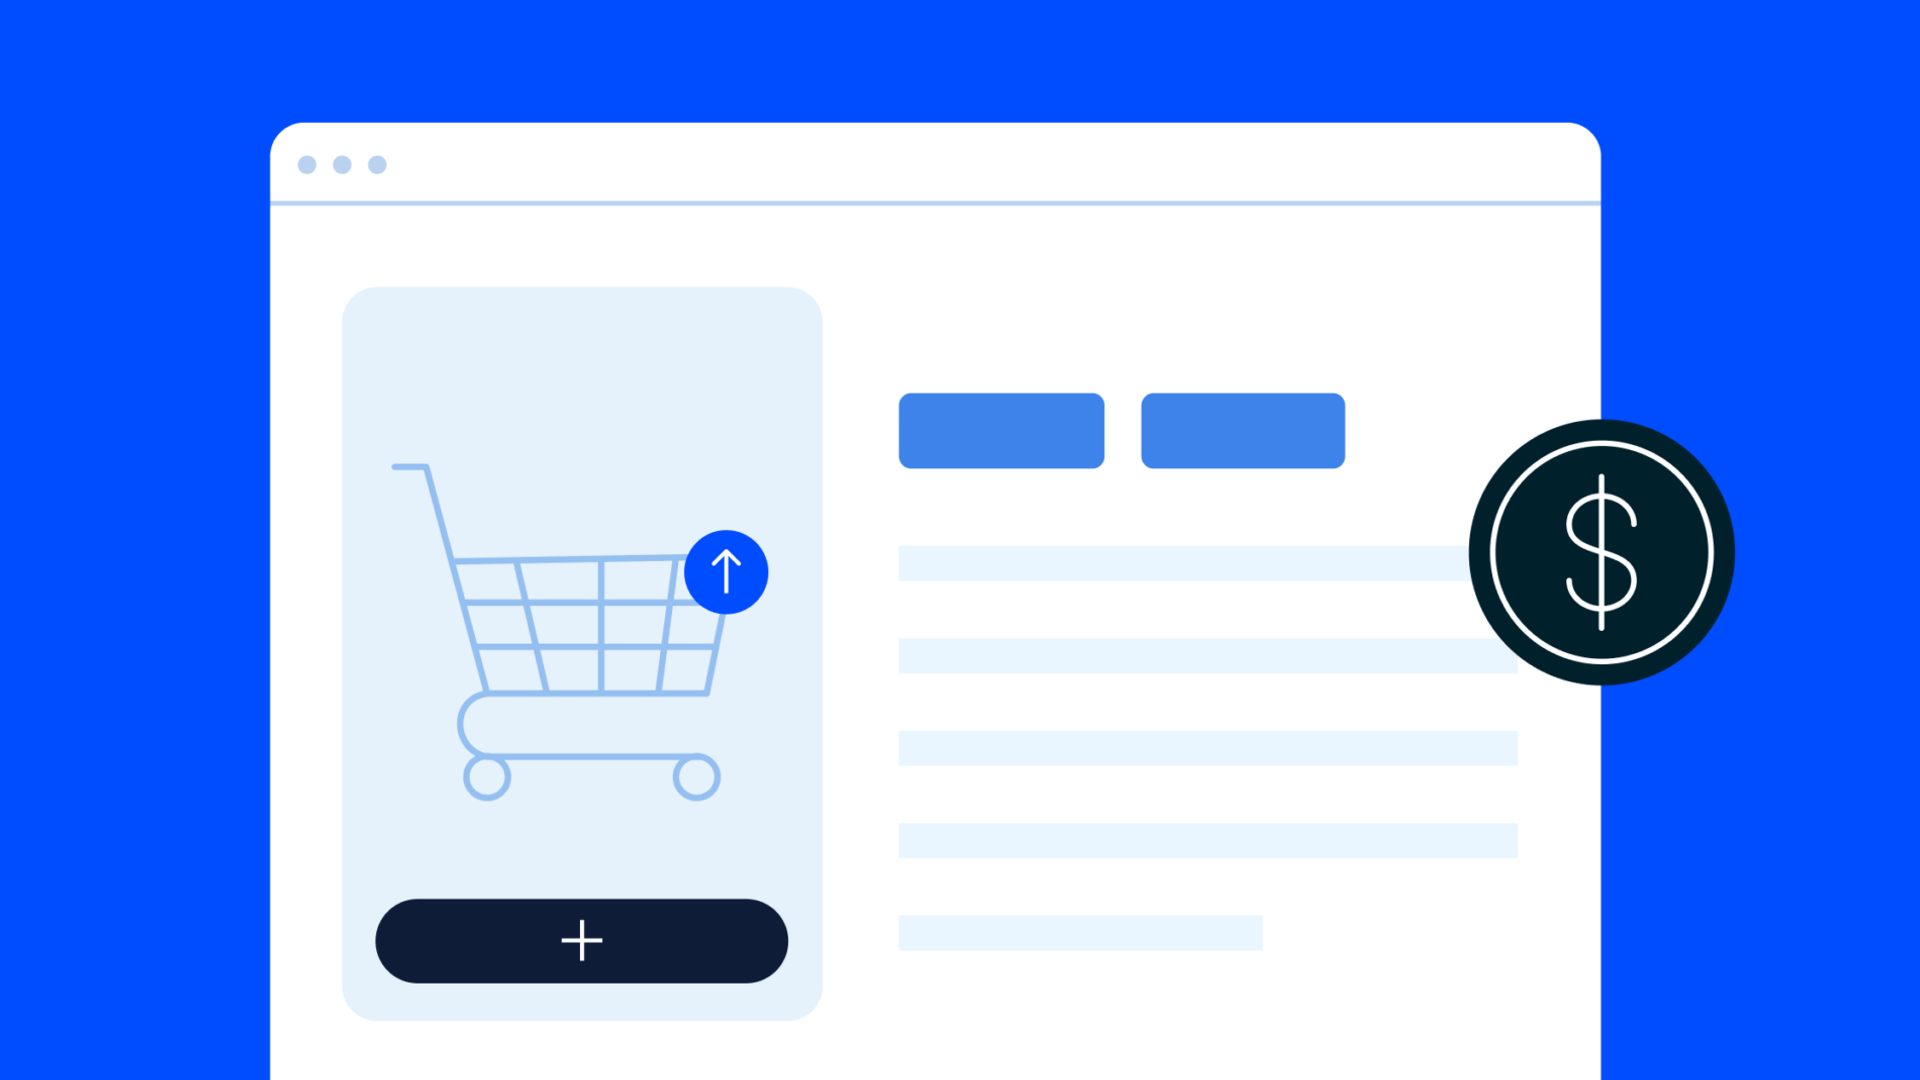
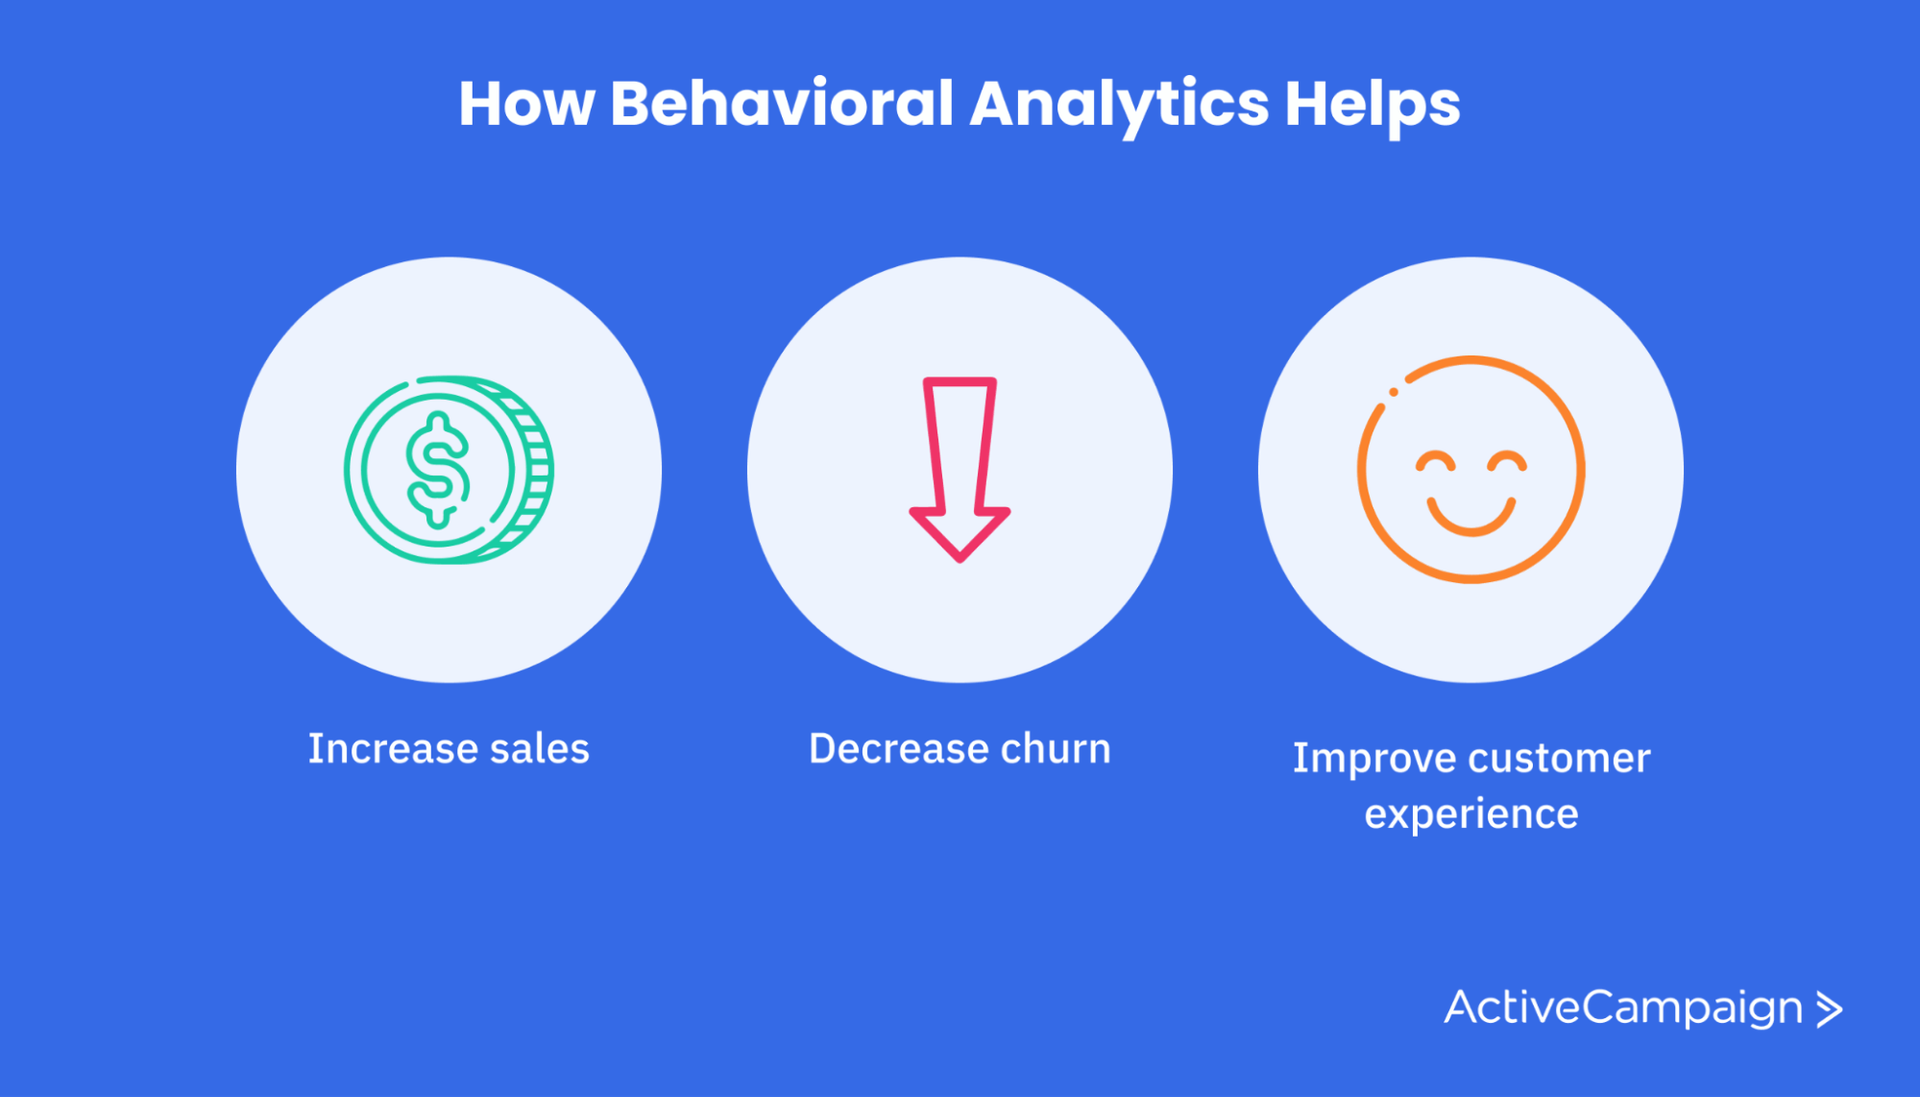
Behavioral analytics can help you increase conversion rates and sales, decrease churn and online shopping cart abandonment (which research finds is nearly 70%), and improve the customer journey.
Behavioral analytics tells you where users are losing interest or what parts of the customer journey aren’t working. When you know what’s working and what isn’t, you can replicate success and fix what needs to be fixed.
Elements of behavioral analytics
There are a few key terms frequently used in behavior analytics. Once you understand what they mean and what they can tell you, you can start developing your own behavioral analytics insights.
User
The user is the person whose behavior you seek to understand (and ultimately influence). A user might be someone using your app, browsing your online merchandise, or signing up for a free trial, among other things.
One of the most important things to remember about users is how you track them determines how accurate and helpful your behavioral data is. If your tracking can’t differentiate between users or recognize an existing user, you’re bound to miss out on critical actionable insights.
You can track users using IP addresses and other signifiers, but there are pitfalls to those. Another way is by using behavioral analytics tools that can use unique tracking IDs to ensure each user’s journey is accurately traced.
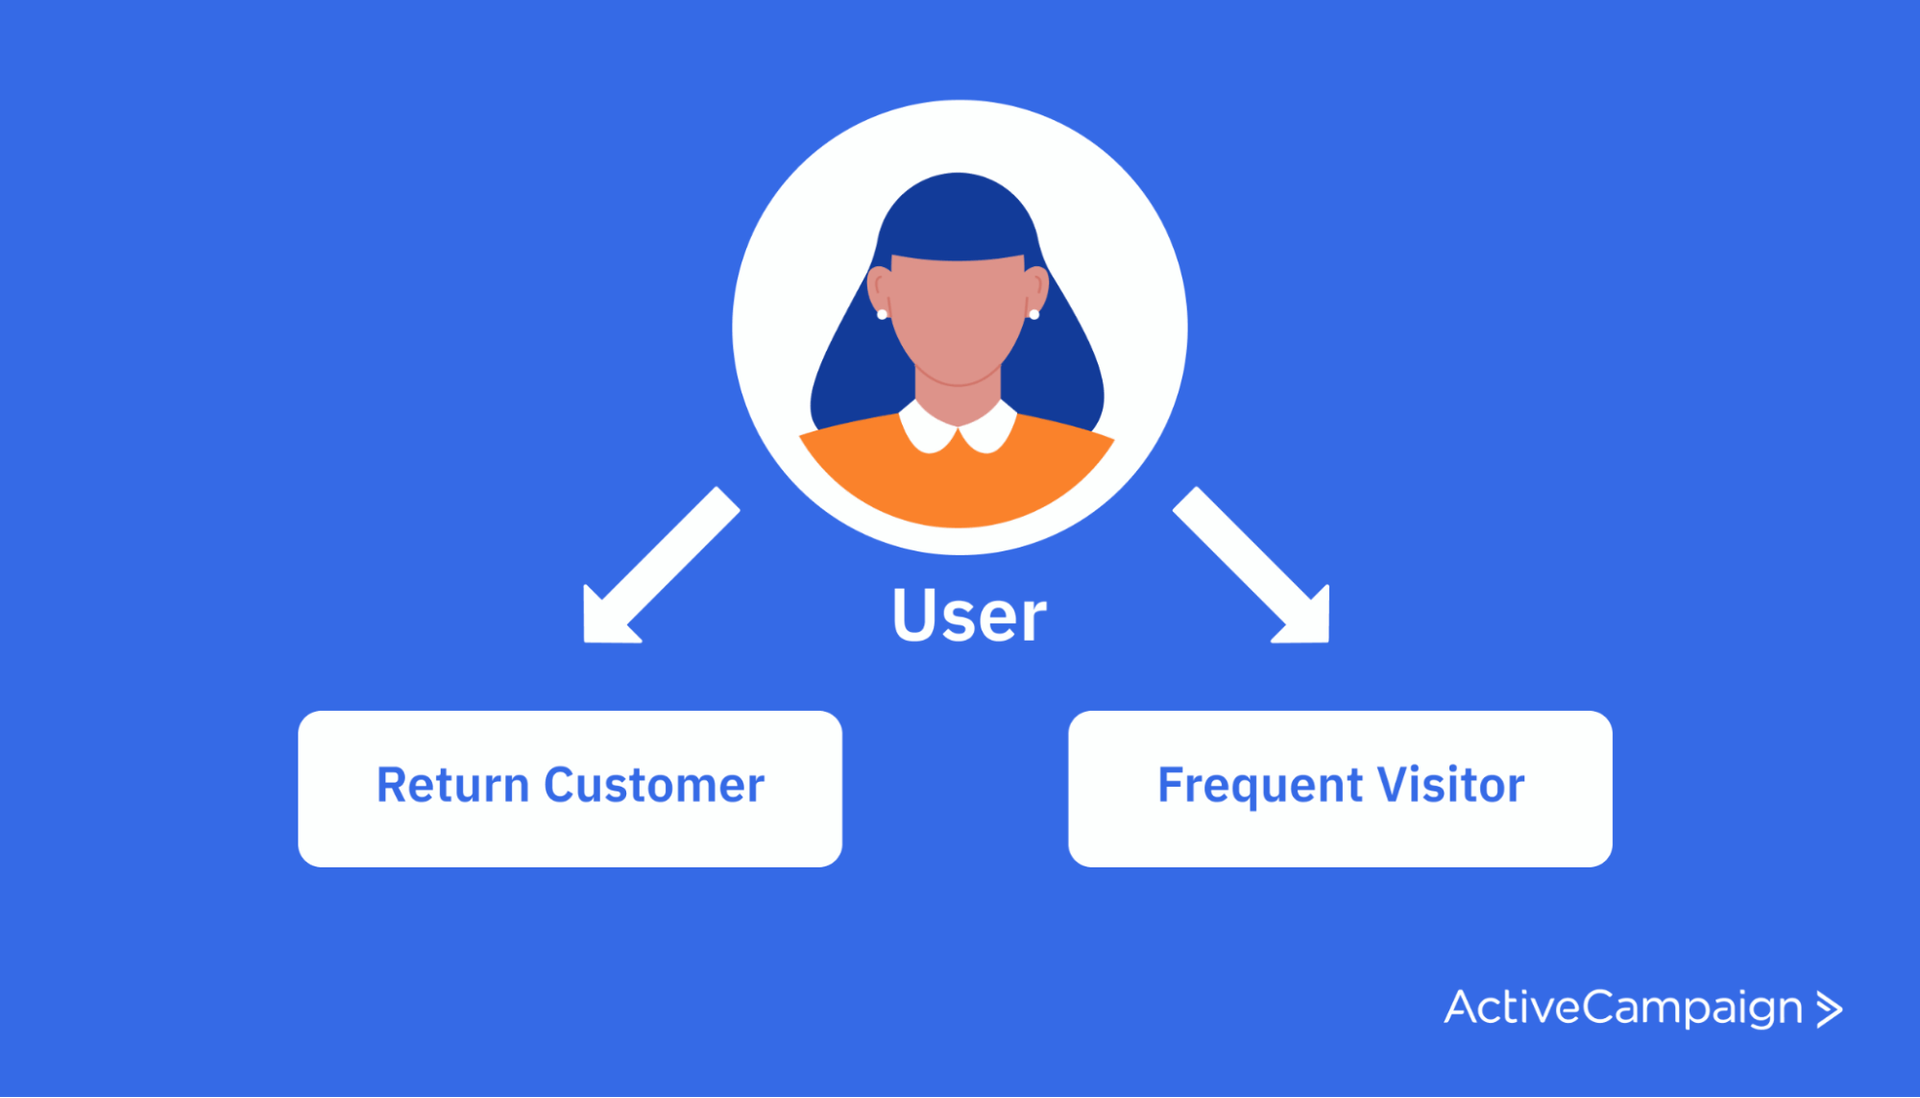
User properties
User properties are important information about users. Some of the most commonly tracked user properties are whether they are an existing customer or a new customer, a frequent user or an infrequent user, etc. Understanding these key characteristics helps you better understand the user’s behavior.
User properties will be essential for segmenting your data and creating behavioral targeting groups as you dive deeper into behavioral insights.
Event
An event is when a user takes some action or engages with your digital property in some way. If users are chess pieces, events are the moves they make.
For example, landing on your website or visiting your blog are events. So is submitting a form, clicking on a CTA, or leaving your site. You can see how people interact with your content and forms by monitoring these user actions.
Some other common events are:
- Downloading your app
- Watching a video
- Entering personal data
- Making a purchase
- Abandoning a cart
- Returning to a page
With behavior tracking, you can watch how one event leads to another. All these events come together to create the customer journey.
Event properties
Like user properties, event properties are details that give you additional context about the event. For example, if the event is someone arriving on your landing page, a useful event property would be the source, meaning how they found the landing page (a link in an email, an organic search, a social media post, etc.)
Some common event properties are:
- Category
- Type
- Duration
- Percent completed
- Status
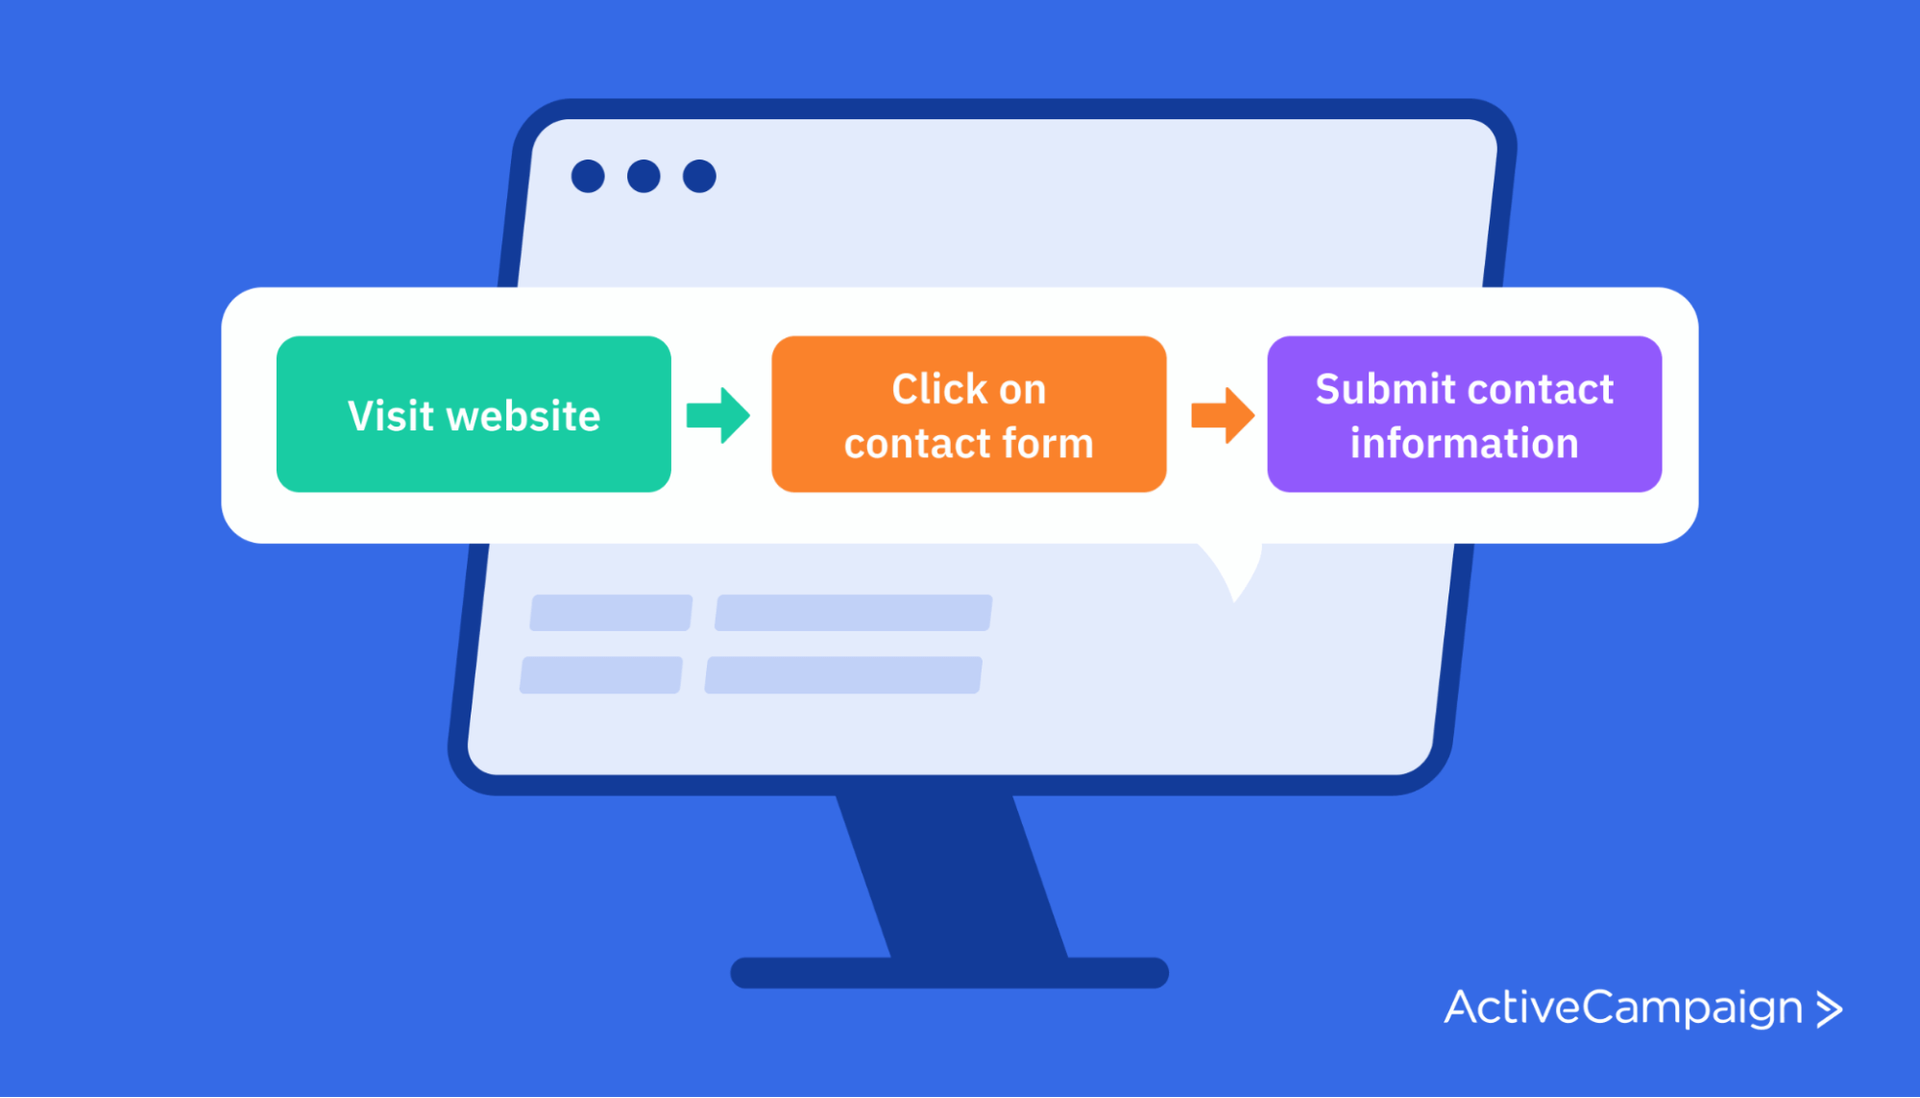
Critical paths
Critical paths are the series of events or actions that occur when a user does something on your website or app.
For example, to make a purchase, they might arrive on your site, click on a product page, add the product to their cart, and check out. Like a recipe, this is a series of steps that allows users to reach their goal.
You can think of critical paths as the “roads most traveled” on your site or digital property. Identifying the sequence of actions helps you track each step and learn what can be improved.
You may find that you are losing users at a particular event in the path. For instance, 24% of users who abandon their carts do so because they are asked to create an account.
What are behavioral analysis tools?
You know that your digital properties are a treasure trove of valuable behavioral data. The trouble you might run into is that collecting behavioral data for behavioral analytics usually requires some type of behavior analytics tool or software. Typically, you connect these tools to your website and other digital properties, and they collect and store the behavioral data.
Which tools you choose will depend on what type of digital behavior you want to track. For example, TowerData is designed for email optimization. Hotjar, on the other hand, is best known for its real-time user recordings and webpage heatmaps. Similarly, MOSTLY AI is one of the best data anonymization tools that help protect sensitive behavioral data by generating realistic but anonymous versions for analytics and AI/ML tasks.
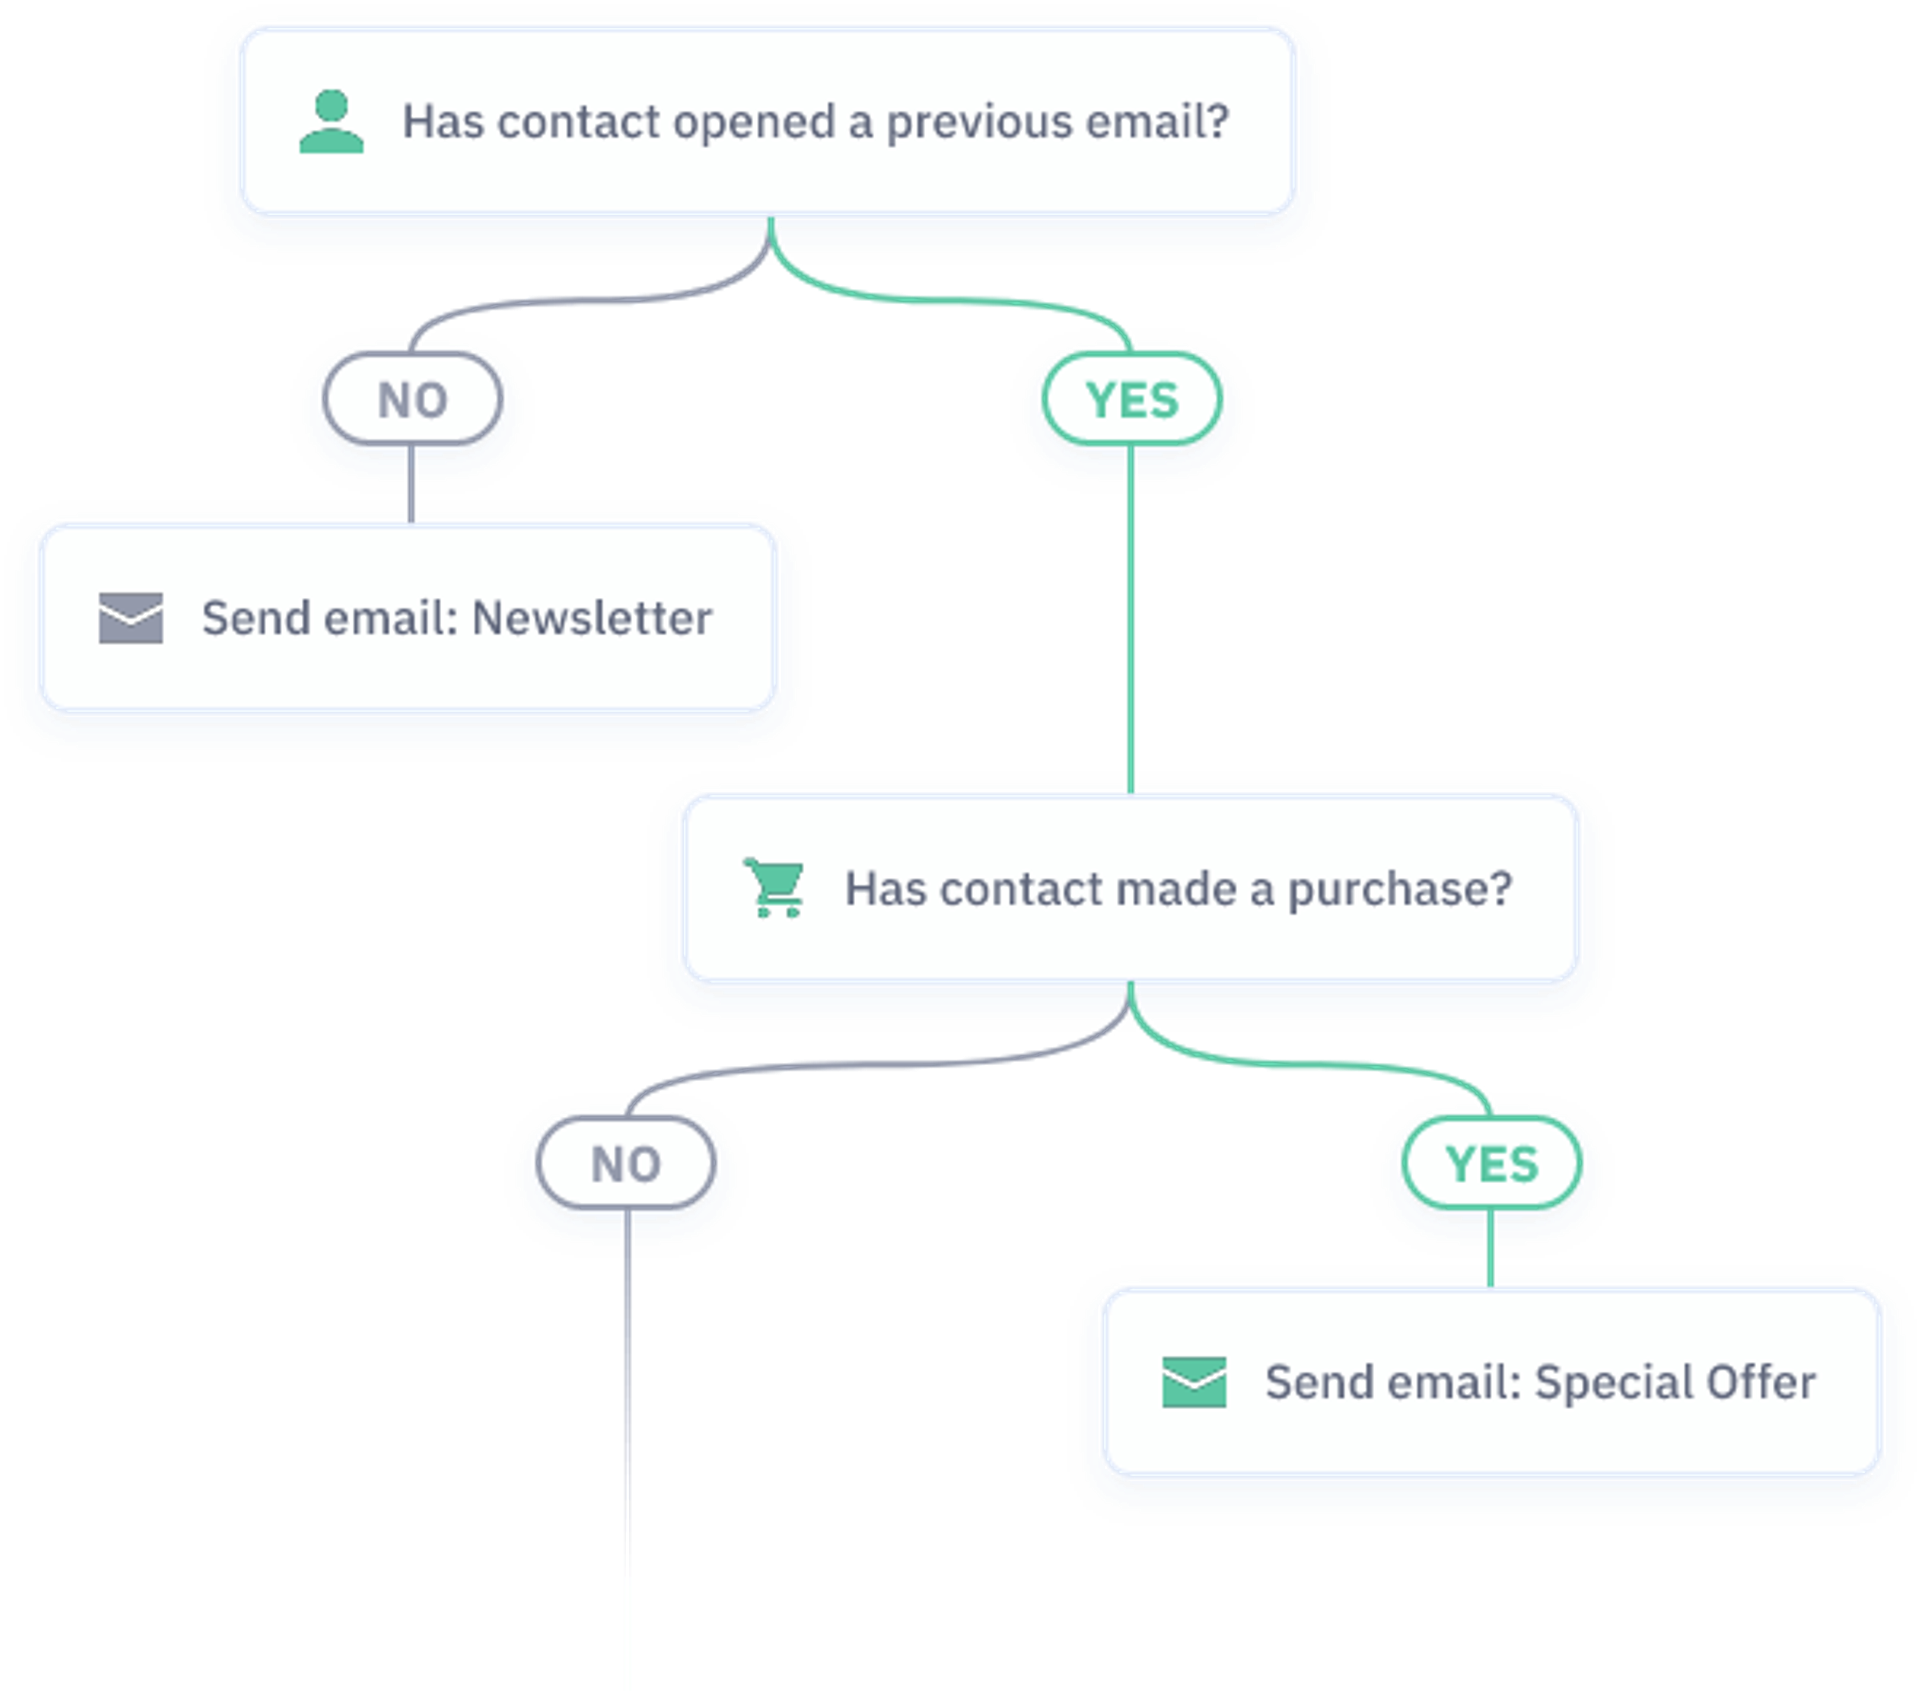
You can also get started with behavioral analytics with ActiveCampaign's event tracking to see what a contact is interested in and then use tagging and segmentation to send them targeted content. Or you can use our email tracking capabilities to trigger automated workflows.
How to start using behavioral analytics
Behavioral analytics is an ongoing process of collecting data, analyzing it, testing changes, and optimizing the customer experience. Furthermore, each business will have a different customer journey to improve and challenges to overcome.
Whatever your industry, you can use these basic steps to get started with behavioral analytics.
Create a client intake form that actually gets results with our FREE intake form template!
1. Define what you want to measure
Before thinking about any changes, you must identify what existing users and events you want to measure. Start with one common user experience, like completing a purchase or creating an account.
2. Use events to map critical paths
For whichever user experience you choose to start with, your next step is to map out the user's critical path to complete that experience.
A good question to ask is, “What events must always occur?” For example, a user would have to visit your website, place a product in their cart, and complete the purchase form to complete a purchase.
Involve people from different teams to make sure you consider all possibilities. By the nature of their work, people from the marketing, sales, and development team will have different insights into each critical path.
Don’t Miss Out On Your Behavioral Analytics
3. Implement tracking
Once you know what users and events you want to measure, it’s time to implement tracking within your technology.
This is when you configure your tools and systems to monitor the events you wish to track.
It’s good to test your tracking once you have it set up. Complete the critical path you’ve set up, and check to ensure your tools noted each event.
4. Study, experiment, and improve
Once you have your tracking set up, you can start collecting baseline data. This will gather data to which you can compare future results and point you toward the first changes or experiments you’d like to try.
You can start small, perhaps just moving a call-to-action button or removing a mandatory field from a form.
Test a single change and collect data over a set period of time. You can then compare this data to your baseline data to see what effect your change had on user behavior.
Remember, if you change more than one detail of a page or event, you probably won’t be able to identify which change created an effect. Like any experiment, you have to test one variable at a time to get good data.
Understand your customers with behavior analytics
As more and more commerce and business occur through digital channels, behavioral analytics will become increasingly important across industries. You can learn about users and customers while identifying what works and doesn’t.
With so much behavioral data being created, it might be difficult to know where to start. The good news is you don’t have to optimize everything all at once. Even one small insight and improvement can increase sales, usage, retention rates, and more.Want to see how ActiveCampaign makes it easy to map out your users’ experience? Start your free trial now.