If you’re an email marketer, you’ve spent plenty of time perfecting subject lines, A/B testing everything from send times to CTAs, and building beautiful automated sequences that work for your unique audience. Your email metrics dashboard is something you reference daily.
But you may be aware that SMS marketing promises another avenue to reach your customers, maybe even more efficiently. Those using SMS marketing software today are enjoying an impressive return on investment (ROI), generating $71 for every dollar spent on SMS campaigns. The truth is that SMS isn’t here to replace your email strategy; it’s the logical next step to enhance the way you engage with your contacts.
When you combine email and SMS strategically, you’re not just adding another channel—you’re creating a multiplier effect. Studies show that integrated campaigns can drive up to 6.6x more purchases than email alone. Think of SMS as your email strategy’s wingman, not its replacement.
This guide will walk you through the SMS metrics that actually matter, building on the analytics expertise you already have. No fluff, no vanity metrics—just actionable insights you need to measure, optimize, and scale SMS alongside your existing email campaigns.
Why SMS metrics are different than email analytics
Before diving into the numbers, it’s important to recognize why the email marketing mindset needs some tweaking when it comes to SMS. The channels might seem similar—both are direct marketing messages—but they operate in fundamentally different ways.
Here's what makes SMS metrics unique:
- The immediacy factor: While your email subscribers might check their inbox a few times a day (if you’re lucky), SMS lives in a different universe. 90% of SMS messages are read within three minutes of being sent. Compare that to email's longer consideration window, and you're looking at two completely different engagement timelines.
- Channel characteristics: SMS boasts higher engagement rates across the board, but the user behavior patterns are different. Your email subscribers might save messages for later, forward them to colleagues, or file them in folders. SMS subscribers? They read, they act, or they ignore.
- Attribution complexity: SMS often acts as a catalyst in email-initiated customer journeys. Someone might discover your brand through email, engage with your SMS campaigns, and then convert. Traditional last-click attribution will miss this entirely.
- Cost efficiency: SMS pricing starts at $0.015 per message in the U.S. and Canada, with additional charges for Unicode messages or exceeding 160-character limits. This makes SMS marketing incredibly cost-effective compared to most other channels.
The distinction between SMS marketing KPIs and metrics
SMS marketing KPIs measure performance by determining how close you are to achieving longer-term business goals. These are strategic, overarching indicators that drive major decision-making about your SMS program.
Key SMS marketing KPIs
- Revenue growth: How much is your SMS program adding to total revenue? What’s your program’s return on investment?
- Subscriber growth: How many new subscribers are you adding monthly? Is your program expanding sustainably?
- Customer engagement: Are customers engaging with your SMS campaigns over time? Which message types drive the highest long-term value?
SMS marketing metrics are quantitative units that help you track and compare specific business processes. They’re more granular and provide tactical insights to identify areas for campaign-level improvement.
Key SMS marketing metrics
- Delivery rate: Percentage of messages successfully reaching recipients
- Click-through rate: Percentage of recipients who clicked links embedded within SMS messages
- Conversion rate: Percentage of recipients who completed desired actions from individual campaigns
Your KPIs should ladder up to your company’s broader goals, while metrics help you optimize individual campaigns and message performance. Both work together to give you a complete picture of SMS success.
The SMS metrics framework every email marketer needs
Let’s talk about the metrics that matter. We’ve organized these into the same framework you may be familiar with from email—foundation metrics, conversion metrics, and advanced attribution. The good news is that your analytical thinking transfers perfectly.
Foundational SMS metrics
These are your bread-and-butter metrics. The ones you’ll check daily and report on weekly.
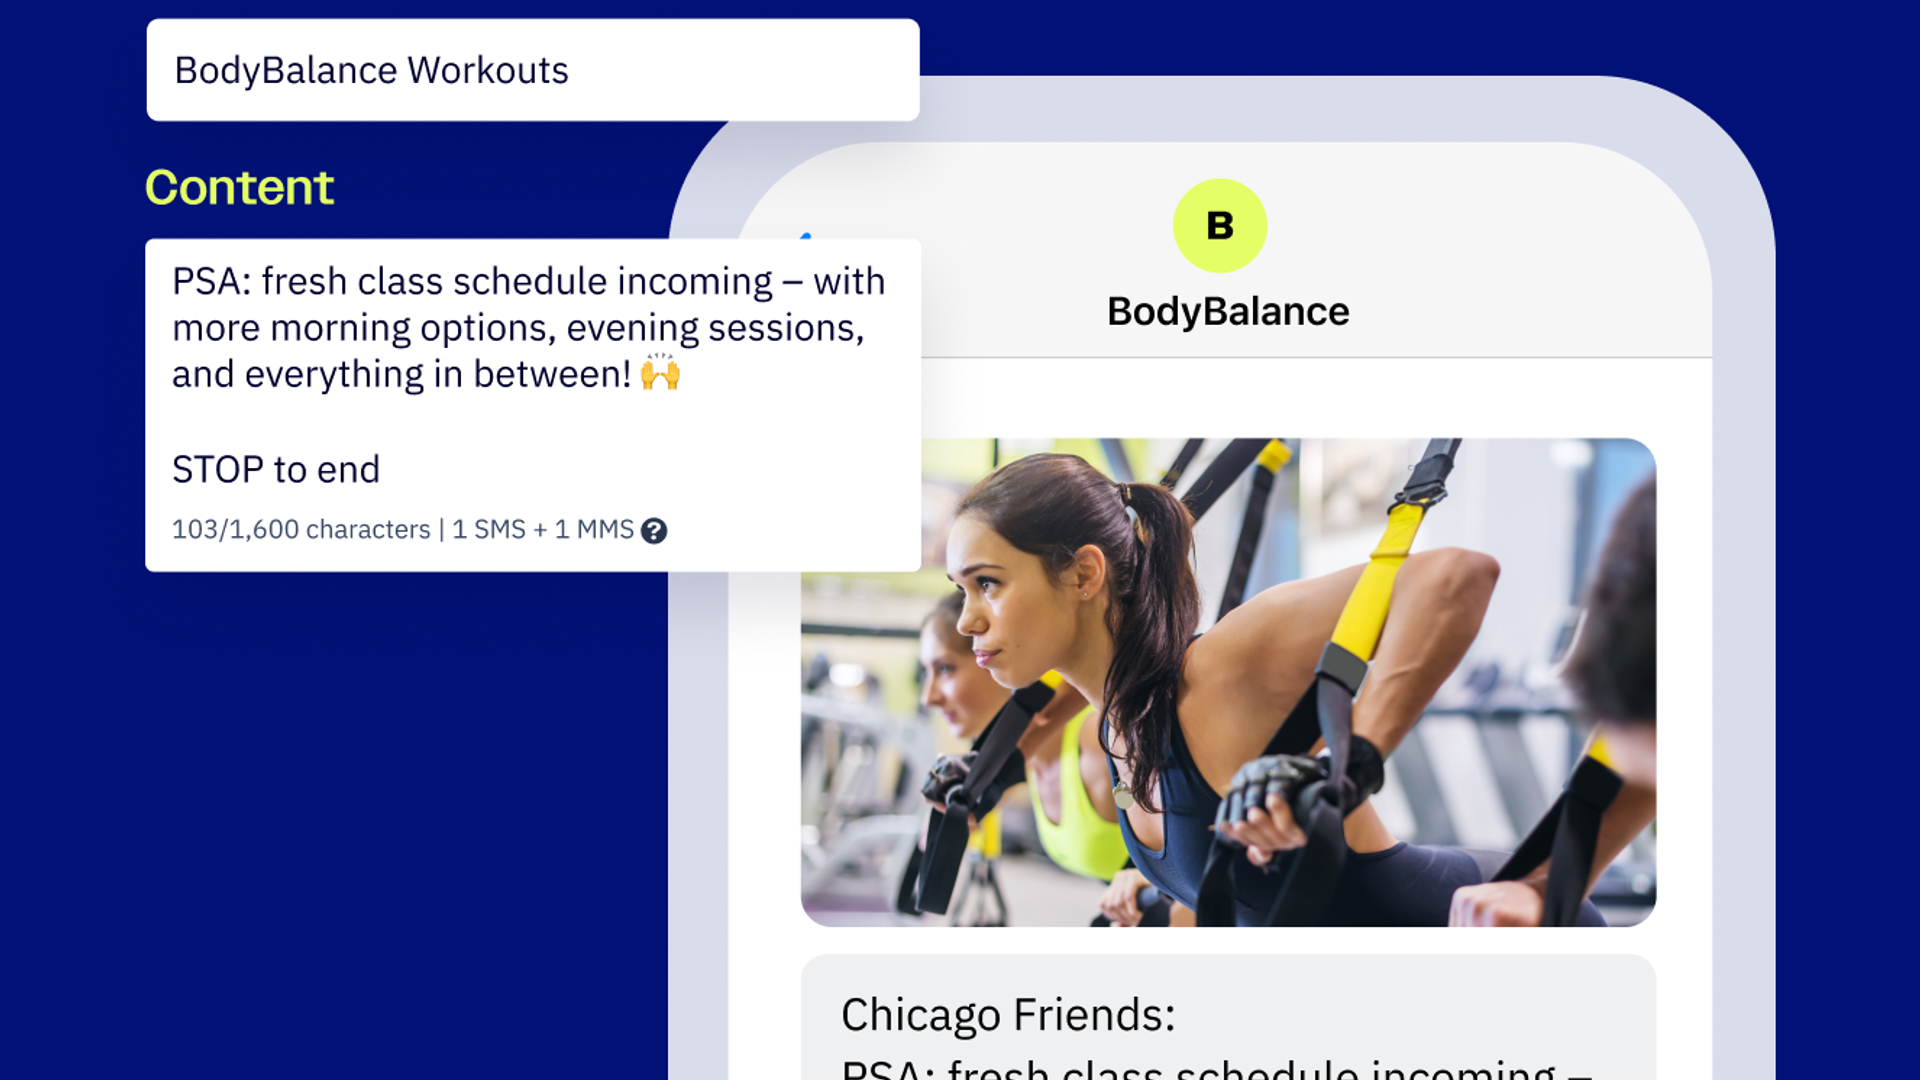
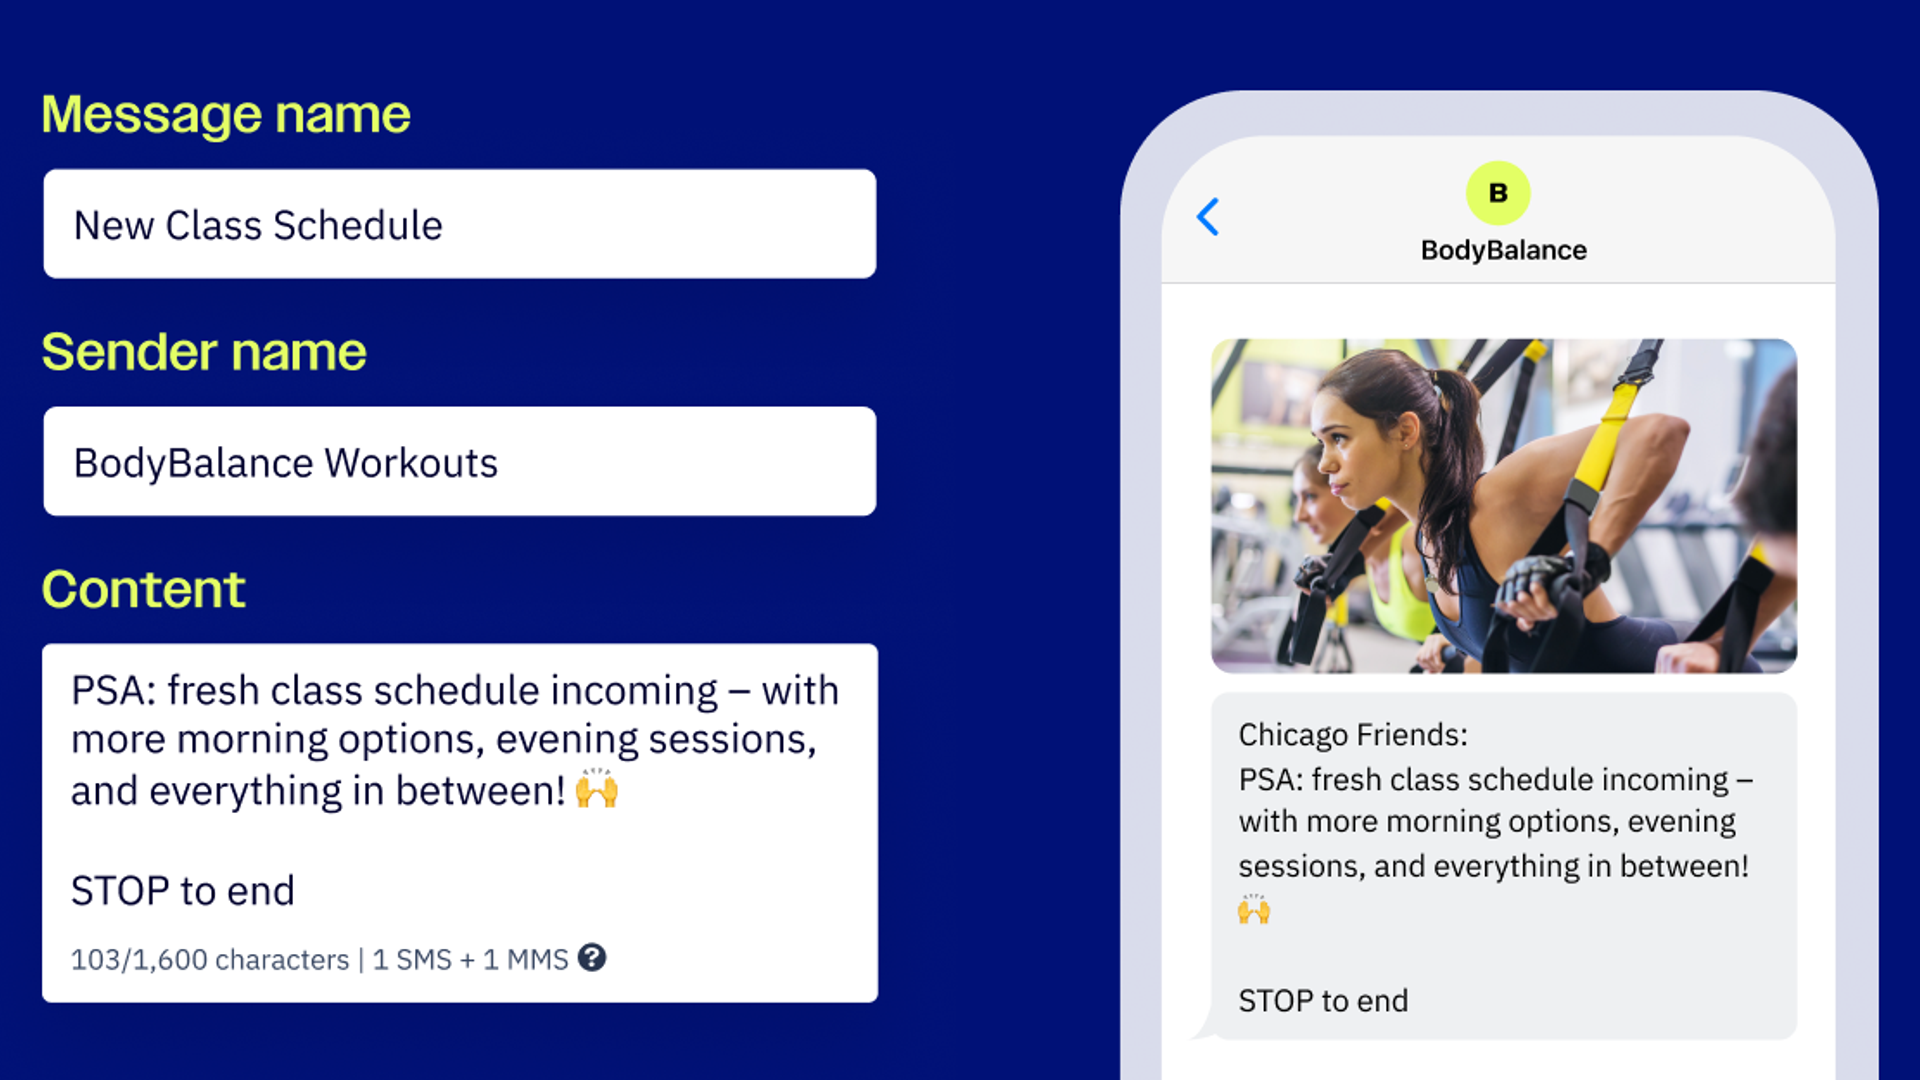
Delivery rate
What it means: The percentage of SMS messages that successfully reach recipients’ devices
Delivery rate formula:
(Number of messages delivered / total messages sent) x 100
Industry benchmark: The industry benchmark currently sits around 98% (compared to email’s ongoing deliverability challenges).
If you start to see your deliverability rate drop below 90%, that could be due to three factors:
- Contact list quality issues
- Carrier reputation problems, meaning carriers have flagged certain messages you've sent as spam
- Technical failures from your SMS marketing provider
Open rate
What it means: The percentage of recipients who open and read a text message out of the total number of messages sent in a campaign.
Open rate formula:
(Number of messages opened / number of messages delivered) x 100
Industry benchmark: SMS open rate typically falls between 90-98% in contrast with email’s ~37% average. Don’t let this doubt the strength of your email metrics. Different channels will produce different results.
A note from the experts: Open rate is actually challenging to measure from a technical perspective, in contrast with email, where you can get very granular tracking on open rate. That's because within email, you can add a 1x1 "tracking pixel" which is essentially an HTML pixel embedded within the email. This can be measured when that pixel is "requested" and delivered to the recipient.
With SMS, you don't have that.
Click-through rate
What it means: Percentage of recipients who clicked links in your SMS messages.
Clikc-through rate formula:
(Total number of clicks / number of people who received the message) × 100
Industry benchmark: While SMS click-through rates vary, the average tends to land between 5-10%. This is significantly more than the average CTR for email, which is 2-3%. Some industries see CTRs as high as 36%, particularly in e-commerce.
Expert tip: Click-through rate is defined and tracked by how many times a link is clicked that is embedded within that SMS marketing message. The distinction is necessary because it’s easy for people to get that confused with when they "click" into that new message within their inbox.
A great way to improve click-through rates is to utilize tools that offer branded links or shortened links, and identify yourself or your business within the message itself. People want to make sure that the links they click on are trustworthy.
Unsubscribe rate
What it means: Percentage of recipients who opt out after receiving messages.
Unsubscribe rate formula:
(Number of unsubscribes / number of messages delivered) × 100
Industry benchmark: Target between 1-2%. This might seem low compared to email, but remember that SMS subscribers are typically more engaged and intentional about their opt-ins.
If you start seeing anything above 5% opt-out of total subscribers a month, there are several factors you can consider to correct it:
- Perhaps, you need to reconsider your send frequency. More isn’t always better.
- You need to increase the relevancy of the content and offers you are sending.
- Segment your campaigns further to increase relevancy to the target audience.
Conversion metrics
This is where SMS starts to flex its muscles and where you’ll see the biggest differences from email.
Conversion rate
The key here is tracking SMS-specific conversions versus email attribution.
What it means: Percentage of recipients who completed your desired action.
Conversion rate formula:
(Number of conversions / number of messages delivered) × 100
Industry benchmark: SMS conversion rates typically range from 21-32%, significantly higher than email's average of 2-3%. The trick is setting up proper attribution so you can see how SMS and email work together in the customer journey.
Revenue per recipient (RPR)
What it means: Average revenue generated per message recipient.
Revenue per recipient formula:
Total revenue generated / number of messages delivered
Industry benchmark: The top 10% of SMS messages drive 7x RPR versus the average
This metric becomes crucial for optimization—you want to identify what makes those high-performing messages different and replicate those elements.
Average order value (AOV)
What it means: The average purchase amount from SMS-driven transactions.
Average order value formula:
Total revenue / number of orders
For example, if a business has a total revenue of $100,000 and 5,000 orders, the AOV is $20 ($100,000 / 5,000 = $20).
Track AOV differences between email and SMS-driven purchases. Many brands find that SMS drives more immediate, impulse-style purchases, while email drives higher-value, considered purchases.
How to get started with email and SMS metric tracking
Think of these metrics like following breadcrumbs to see how your customers actually buy from you. Right now, you might only see the final purchase, but you're missing the whole story of how they got there.
1. Multi-touch attribution (following the customer journey)
What this actually means: Instead of just knowing "Sarah bought a $50 item," you'll see "Sarah opened your email about winter coats, then clicked the SMS you sent 3 hours later, then bought the coat the next day."
How can you start tracking this today?
Step 1: Set up basic tracking links
In your email platform (ActiveCampaign, Mailchimp, Klaviyo, etc.), use UTM codes for every link.
Example: yourstore.com/winter-coats?utm_source=email&utm_campaign=winter2024
In SMS, use similar links: yourstore.com/winter-coats?utm_source=sms&utm_campaign=winter2024
Step 2: Connect your platforms
Most email and SMS platforms can track the same customer across both channels.
Make sure you're using the same customer email/phone to identify them. If using separate tools, export data monthly and match customers manually in a spreadsheet.
Step 3: Look for patterns
Check your analytics weekly: Are people who get both email and SMS buying more?
A simple question you can ask yourself: "Of my last 100 customers, how many touched both channels before buying?"
2. Time-to-conversion (how fast SMS makes people buy)
With this metric, you’re measuring how much faster people buy when you follow up an email with a text message.
An easy way to track this:
Week 1 test: Send an email about a sale on Monday Don’t send any follow-up SMS Track how many people buy by Friday | Week 2 test: Send the same type of email on Monday Send an SMS follow-up on Tuesday Track how many people buy by Friday |
|---|
In the end, it’s likely that you’ll find the email and SMS group buys faster and more often.
Tools you can use:
Google Analytics (free): Look at "time to conversion" reports
Your email platform's analytics: Most show "time from send to purchase"
Even a simple spreadsheet works: Column A = customer name, Column B = email sent date, Column C = SMS sent date, Column D = purchase date
3. Cross-channel lift (proving SMS actually works)
You want to prove that adding SMS to your email strategy actually makes you more money and doesn’t add additional confusion. A cross-channel approach is meant to make your efforts more effective, not just move sales around.
Swipe this testing framework
To get started this week, here’s an action plan you can use to start testing cross-channel attribution.
Day 1-2: Set up basic tracking
- Add UTM codes to your email links
- Add UTM codes to your SMS links
- Check that your website analytics can see these codes
Split your customer list in half:
Group A: Gets emails only (like you've always done)
Group B: Gets emails and SMS follow-ups
Day 3-4: Plan your first test
- Pick one upcoming email campaign
- Plan to send an SMS follow-up 2-4 hours later
- Make sure you can track who gets what
Run this for one month, then compare:
- Did Group B buy more stuff?
- Did they spend more money per person?
- If yes, SMS is working. If no, adjust your approach.
Example:
- 1,000 email-only customers bought $10,000 worth of stuff
- 1,000 email + SMS customers bought $13,000 worth of stuff
- SMS lifted your sales by 30% = it's working!
The key is starting simple. You don't need perfect data to see if SMS is helping your email campaigns work better. Even basic tracking will show you patterns that can guide your strategy.
SMS benchmarks that matter today (based on real data)
Let’s talk real numbers. Here are the benchmarks you should be measuring against, broken down by industry and use case. You’ll see that every industry prioritizes different metrics that correlate with what they consider important to measure success.
Industry-specific SMS benchmarks
E-commerce: Average click-through rate of 36%, average conversion rate of 4.2%
- E-commerce brands saw a 27x ROI and a 230% increase in sales volume through SMS campaigns.
- Abandoned cart SMS messages perform particularly well, with conversion rates between 24.6%-39.4%.
SaaS/B2B: In the software industry, there’s a large focus on engagement rate, emphasis on lead qualification, and nurturing metrics.
- The average response rate for SMS marketing campaigns is around 30%, compared to an average email response rate of 5-15%.
Healthcare: The healthcare industry places heavy emphasis on delivery and compliance metrics.
- SMS appointment reminders achieve the lowest no-show rate at 19%.
- Compliance tracking is critical due to HIPAA considerations.
Financial services: In the financial sector, there’s a strict focus on opt-in rates and security metrics.
- Financial services tend to have higher scrutiny on consent and data protection.
- Transaction alerts and fraud prevention messages typically see the highest engagement.
Noting the importance of security, Jeff Iles, SVP of Client Experience at First Horizon Bank, shares how the financial services industry is thinking about SMS marketing:
While SMS is not currently a core component of our engagement strategy, we recognize its potential for delivering critical time-sensitive notifications such as security alerts where immediate attention is paramount.
Size-based performance expectations
- List size and segmentation: Larger, unsegmented lists typically see slightly lower engagement rates due to diluted targeting. Segmented SMS campaigns deliver 38% higher revenue per message than broadcast texts to entire subscriber lists.
- Send frequency correlation: Most consumers prefer receiving 4-6 SMS per month, though 19% are open to daily messages.
- Seasonal variations: Q4 performance typically sees higher engagement rates, with SMS databases growing an average of 41% during holiday seasons.
How to integrate SMS metrics with your existing email analytics
So you know which SMS metrics you may want to start tracking as you implement conversational messaging into your existing marketing strategy—but how do you actually go about doing so? You can stop thinking of SMS and email as separate channels and begin treating them as an integrated system. Let’s take a look at how to implement each component so you can move from theory to execution.
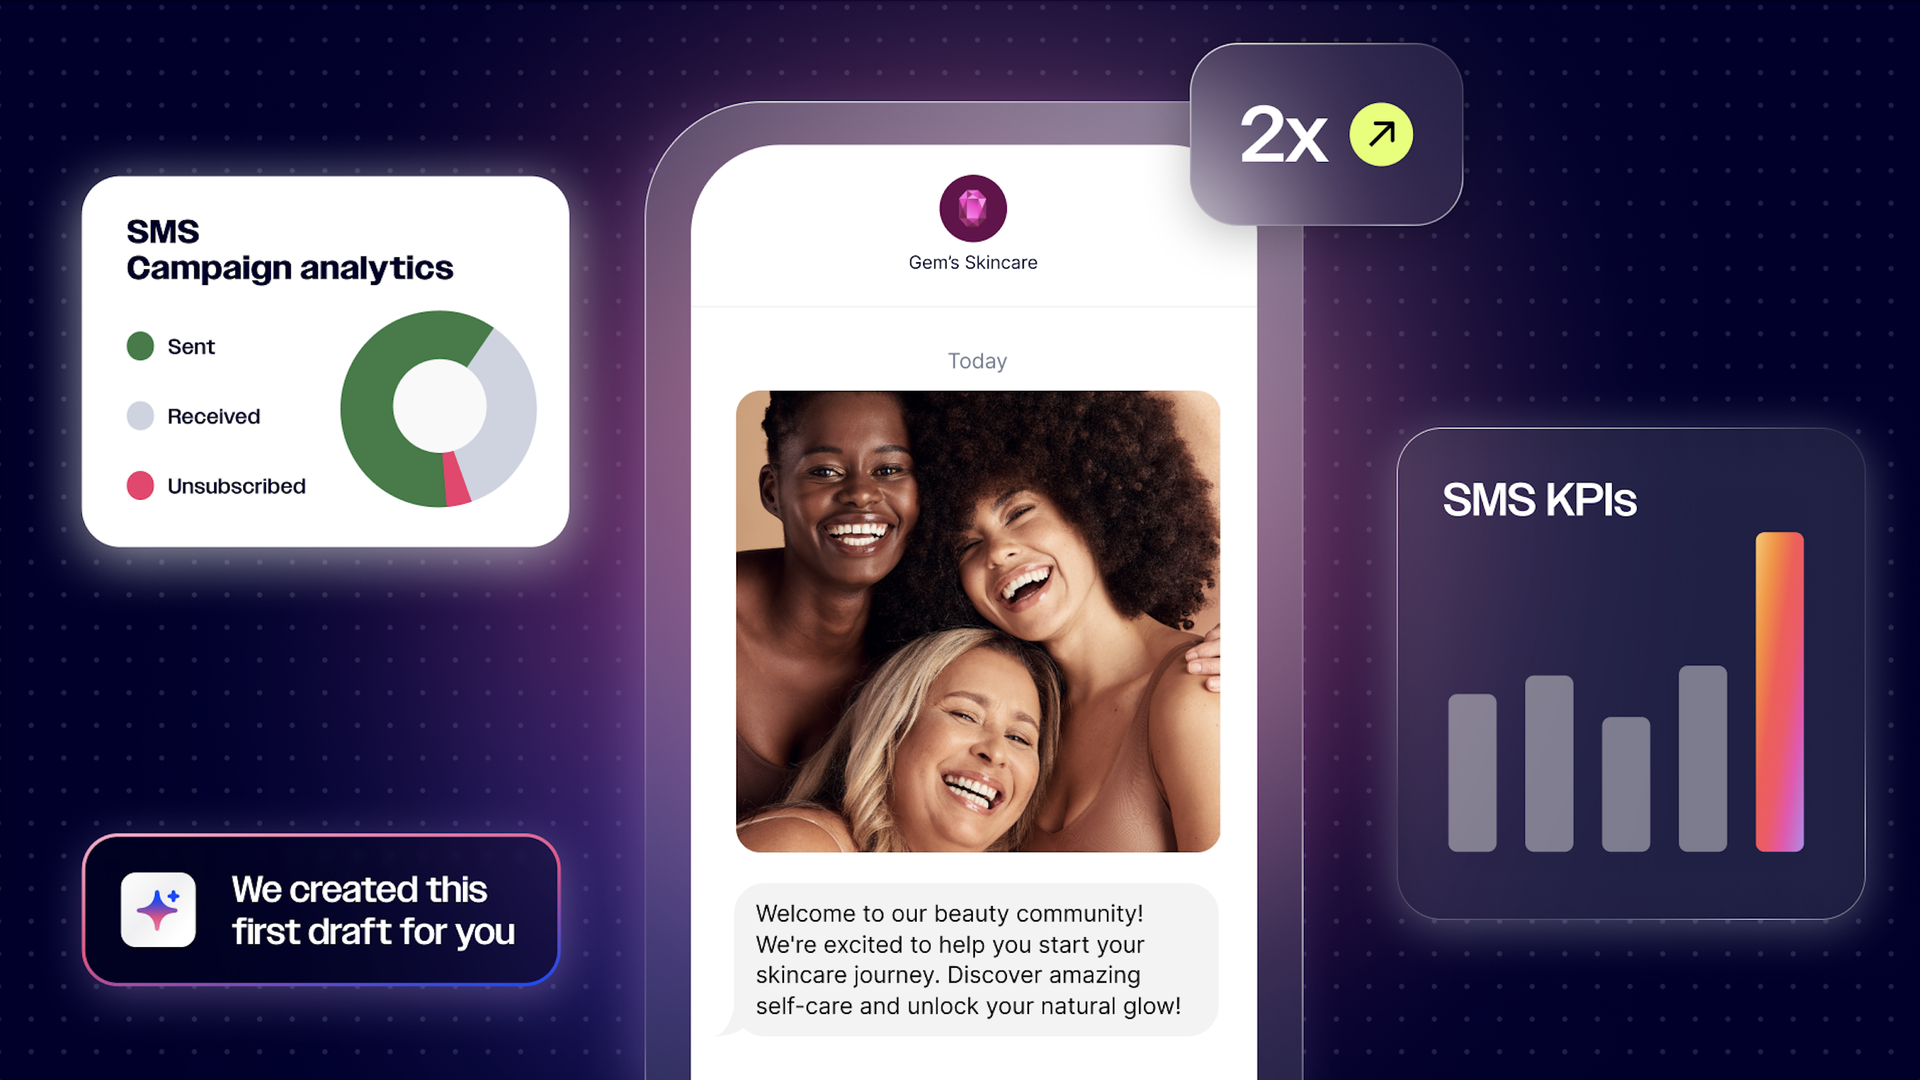
Building your unified dashboard
Creating single-view reporting
The real advantage isn't necessarily having everything in one report—it's having everything in one platform. This eliminates the constant platform-switching that fragments your analysis and leads to missed insights.
In ActiveCampaign, you can leverage the aggregate performance reporting to create dedicated SMS tracking alongside your existing email analytics. While you might set up separate reporting pages for SMS performance tracking (using their SMS dashboard capabilities), the crucial benefit is that both your email and SMS data live within the same ecosystem.

This means consistent data definitions, unified contact records, and the ability to cross-reference performance without exports or integrations.
Start by identifying which metrics matter across both channels—engagement rates, conversion rates, revenue attribution, and customer lifecycle stages. In ActiveCampaign's reporting section, create your SMS performance dashboard while maintaining access to your email reporting. The power comes from being able to pivot between these views instantly, seeing how the same contact segments perform across both channels without losing context or dealing with data synchronization delays.
The single-platform approach means your contact data, segmentation rules, and campaign history create a unified foundation for both channels. When you're analyzing why a particular segment responded better to SMS than email, you can immediately access their complete engagement history, behavioral triggers, and demographic data without switching tools or dealing with data export delays.
Implementing cross-channel segmentation
This requires rethinking how you categorize your audience. Instead of having separate email and SMS subscribers, you can create behavioral segments that span both channels.
Start with these foundational segments:
- High performers (engaged on both channels)
- Email-preferred (high email engagement, low SMS engagement)
- SMS-preferred (high SMS engagement, low email engagement)
- At-risk (declining engagement across both channels)
- New subscribers (recent opt-ins to either or both channels)
In your platform, create these segments using combined criteria. For example, "Email-preferred" might be defined as someone with >30% email open rate in the last 30 days AND <10% SMS click rate in the same period. These segments become the foundation for targeted re-engagement campaigns.
Technical implementation tips
Data integration requirements
If you’re using separate platforms, aim to establish regular data syncing. Set up automated exports from each platform that feed into a central database or analytics tool.
Also, create unique customer identifiers that work across both systems—typically email address or phone number.
Measurement standardization
Define metrics consistently across channels. “Engagement” should mean the same thing whether you’re measuring email or SMS performance. You can even create a data dictionary that defines every metric you’ll track and how it’s calculated.
Testing framework
- Establish statistical significance thresholds before you start testing.
- Determine minimum sample sizes needed for reliable results.
- Create testing calendars to avoid overlap between different experiments that might skew results.
The goal isn’t perfect measurement immediately; it’s building systems that improve your understanding over time. Start with the basics, get those working reliably, then layer on sophistication as your data quality and volume improve.
Advanced SMS metrics that go beyond 101
Once you’ve mastered the basics, these advanced metrics will help you optimize at a much deeper level. Here’s what each advanced metric means, how to measure it, and the data that proves why it matters.
Customer lifetime value (CLTV) analysis
What it is: Customer lifetime value analysis in an SMS context measures the total revenue you can expect from customers based on how they engage across your SMS and email channels. This goes beyond simple campaign ROI to understand long-term customer relationships.
Customer lifetime value formula:
(Average purchase value x average purchase frequency) x average customer lifespan
For example, if a store has an average sale of $50, customers typically purchase twice a year on average, and stay in the store’s purchase history for three years: CLTV = ($50 x 2) x 3 = $300
Research consistently shows that cross-channel shoppers (those engaging with both email and SMS) have a 30% higher lifetime value than single-channel customers, with some studies indicating cross-channel subscribers retain at 89% compared to 33% for single-channel approaches.
Cohort tracking
How to measure: Create customer cohorts or segments based on their channel engagement patterns. Track these groups:
- Email-only subscribers
- SMS-only subscribers
- Email and SMS subscribers
- Late adopters (started with one channel, added the second)
Monitor each cohort’s spending patterns, purchase frequency, and retention rates over 12-24 month periods.
What to track:
Once you’ve created separate segments for each cohort in your chosen platform, you can begin tracking actions that can help you understand the impact of each channel.
- Average order value by cohort
- Purchase frequency differences
- Time between first purchase and churn
- Total revenue contribution per subscriber type
You may find that taking a cross-channel approach produces the best results. And there’s data to back this up. Companies with extremely strong cross-channel customer engagement see a 9.5% year-over-year increase in annual revenue, compared to 3.4% for weak cross-channel companies.
Value per subscriber analysis
This is a key metric that measures how much financial value each subscriber generates for your business. It’s particularly important for subscription-based businesses, SaaS companies, and any business with recurring customer relationships.
The strategic insight: SMS marketing generates an average ROI of $73 for every $1 spent, with revenue per message reaching up to $3.27 and subscriber lifetime value soaring as high as $335.49.
You can measure your subscribers’ value by using a few different calculations:
- Average revenue per user (ARPU): Total revenue / number of active subscribers
- Monthly recurring revenue (MRR) per subscriber): Total MRR / total active subscribers
When you measure this metric across both email and SMS, it reveals which subscribers yield the highest value and should inform your budget allocation between channels.
Predictive analytics
What it is: Predictive analytics uses machine learning and statistical models to forecast customer behavior before it happens, enabling proactive rather than reactive marketing strategies.
Churn prediction
Brands can use machine learning and behavioral data to identify which customers are likely to disengage—and then take action while there’s still time to win them back.
Churn rate formula: There isn't a single "simple formula" for predicting future churn (that requires machine learning), but there are simple ways to calculate historical churn rate and create basic risk scores:
(Customers lost during period / total customers at start of period) × 100
For example, if you started with 1,000 customers and lost 50 in a month: Churn Rate = (50 ÷ 1,000) × 100 = 5%
How to measure:
Set up automated tracking in your SMS platform to monitor key warning signs: customers showing declining engagement patterns, reduced click-through rates (SMS industry average is 20-36%), or increasing unsubscribe trends (aim to keep below 3%).
Then, create a simple spreadsheet to track these "at-risk" customers weekly, following up after 30-60 days to see who actually churned. Calculate your prediction accuracy by dividing correct predictions by total predictions—machine learning models for churn prediction typically achieve 70-85% accuracy, with more sophisticated models reaching 90%+.
Test retention campaigns on flagged customers (send special offers or surveys), then measure how many stay engaged. Track the cost of retention campaigns versus the revenue saved from preventing churn to prove ROI.
Key indicators to track:
- Declining SMS open rates over 30-day periods
- Increased time between SMS clicks and purchases
- Changes in optimal send time patterns (suggesting lifecycle shifts)
- Reduced response rates to promotional SMS campaigns
Optimal send time prediction
AI-powered send time optimization can improve message engagement by 52% compared to generic send times and 100% better than baseline approaches. Plus, it was also found that AI timing based on customer activity can improve response rates by 40%.
What does optimal send time prediction analyze?
- Individual customer engagement patterns across both SMS and email
- Time zone considerations and location-based preferences
- Seasonal and weekly behavioral patterns
- Historical response data to determine peak engagement windows
What are we actually predicting?
For both email and SMS, you’re trying to predict when each person (or group of people) will be most receptive. This means looking for patterns in when they:
- Open messages quickly
- Click on links
- Make purchases
- Don’t immediately delete or unsubscribe
How do you measure success?
- Engagement rate: The percentage of people who actually interact with your message (open, click, reply). If you normally get 20% open rates but suddenly get 35% when you send at 2 pm on Tuesdays, that’s a strong signal.
- Response speed: How quickly people engage after receiving the message. Faster responses usually mean better timing.
- Conversion rate: Whether people actually do what you want them to do (buy something, sign up for a class, etc.).
- Negative actions: Track unsubscribes, spam complaints, or people turning off notifications. A spike in these suggests poor timing and that you need to rethink your strategy.
Compliance and deliverability
This is crucial for email marketers transitioning to SMS. Current regulations like TCPA and 10DLC significantly impact SMS differently than email deliverability.
The SMS landscape is much stricter than email. While email has CAN-SPAM, SMS operates under TCPA (Telephone Consumer Protection Act), which requires explicit consent for every subscriber. This means:
- Double opt-in isn’t just best practice—it’s often legally required
- Unsubscribe must be immediate and honored within minutes, not days
- 10DLC (10-Digit Long Code) registration is mandatory for most business texting
- Message content is more heavily scrutinized by carriers
The good news is that SMS deliverability is more predictable than email. There’s no spam folder equivalent, and carrier filtering is more transparent. When your message is sent, it either delivers or it doesn’t—no mystery middle ground.
Common SMS metric mistakes email marketers make
To save you a headache, we’ve put together some of the most common mistakes email marketers may make when transitioning to SMS.
Solely focusing on vanity metrics
Total subscriber count matters less than engagement quality in SMS. A highly engaged list of 1,000 subscribers often outperforms a poorly engaged list of 10,000.
Email thinking is applied incorrectly
SMS requires different optimization approaches. What works in email (long copy, multiple CTAs, complex designs) often fails in SMS.
Attribution oversimplification
Missing the compound effect of cross-channel strategies by only looking at last-click attribution.
Frequency assumptions
Email frequency rules don’t directly translate to SMS. Most consumers can handle daily emails, but prefer SMS 2-3 times per week maximum.
Tools and setup for SMS metric tracking
To start, let’s talk about what an essential tracking setup might look like and the things to keep in mind as you track SMS metrics. It starts with UTMs.
UTM parameters for SMS: How to implement
Adapting your email UTM strategies for text campaigns requires specific modifications due to SMS character constraints and mobile behavior patterns. Here’s a step-by-step setup to get you started:
1. Create shortened UTM codes: Use abbreviations to save characters
- Instead of utm_source=email_newsletter use utm_source=sms
- Replace utm_campaign=summer_sale_2024 with utm_campaign=sum24
- Limit utm_content to 3-4 characters: utm_content=cta1 instead of utm_content=shop_now_button
SMS UTM structure example: yoursite.com/sale?utm_source=sms&utm_medium=txt&utm_campaign=flash24&utm_content=btn1
2. Use URL shorteners strategically
- Implement bit.ly, tinyurl.com, or your domain’s customer shortener
- Always test shortened links before sending
- Create UTM parameters first, then shorten the full URL
3. Track by message type
- Welcome series: utm_campaign=wel_sms
- Promotional: utm_campaign=promo_sms
- Cart abandonment: utm_campaign=cart_sms
- Transactional: utm_campaign=trans_sms
Landing page optimization: SMS-specific requirements
SMS-driven traffic behaves differently from email traffic, requiring dedicated optimization. Here’s a complete setup checklist:
1. Mobile-first design requirements
- Page load time under three seconds (use PageSpeed Insights to test)
- Single-column layout that fits mobile screens
- Thumb-friendly buttons (minimum 44px height)
- Eliminate horizontal scrolling entirely
2. Immediate action optimization
- Place primary CTA above the fold (visible without scrolling)
- Use contrasting button colors (test red, orange, or green against your brand colors)
- Include phone number and click-to-call buttons for immediate contact
- Remove navigation menus that distract from conversion goals
3. Content strategy for SMS traffic
- Lead with the offer mentioned in your SMS (maintain message consistency)
- Use larger fonts (minimum 16px) for readability on mobile
- Include social proof above the fold (reviews, testimonials, trust badges)
- Keep forms to three fields maximum (name, email, phone)
How to view an individual SMS campaign performance report
For this guide, we’ll walk through how you can set up a view of your individual SMS campaign performance report. Here’s how to set it up.
- Click SMS tab on the left-hand navigation bar
- Select "SMS Campaigns Performance" in the left menu
- Locate the specific SMS Campaign send for which you want to view the report
- Click the "Report" quick action button
You’ll be able to see a range of metrics including:
- Total sent
- Delivery rate
- Reply rate
- Click rate
- Fail rate
- Opt-out rate
- Replies
- Failed details
To view aggregate SMS campaign performance:
- Click SMS tab on the left-hand navigation bar
- Select "SMS Campaigns Performance" in the left menu
This dashboard lets you view campaign outcomes and success metrics at a glance.
Optimizing your campaigns based on SMS metric insights
The fastest path to SMS optimization starts with send time analysis, where engagement data reveals optimal timing windows that often yield 10-20% engagement improvements immediately. By analyzing open rates across different hours and days of the week, you can identify when your audience is most receptive to messages and schedule accordingly.
This timing then informs your content strategy, as the correlation between character count and engagement helps you understand whether your audience prefers concise messages under 160 characters or responds better to longer, more detailed text messages.
Building on these insights, CTA optimization becomes your next growth lever—testing different call-to-action approaches like "Shop Now" versus "View Deal" versus "Get 20% Off" within SMS's limited format requires creativity but can deliver dramatic results, with some brands seeing up to 231.7% improvements in click rates through strategic CTA refinement.
Advanced optimization strategies
Sophisticated optimization requires treating SMS and email as interconnected systems rather than isolated channels. Dynamic segmentation creates a powerful feedback loop where SMS engagement levels inform email targeting strategies. For example, highly engaged SMS subscribers can receive exclusive previews and early access offers via email, while low SMS engagers automatically enter re-engagement sequences across both channels.
This cross-channel intelligence enables advanced A/B testing methodologies where you test unified campaigns with coordinated timing intervals, such as immediate SMS follow-up versus 2-hour or 24-hour delays after email sends, often resulting in ROI improvements from optimized cross-channel orchestration.
Why use ActiveCampaign for SMS metric tracking?
Did you know that in 2024, 80% of businesses reported using SMS marketing software to text their customers, and nearly 70% are increasing their SMS marketing budgets?
The key is choosing a platform that embeds SMS into its product, thinking beyond just a one-channel approach. Most platforms handle email, SMS, and social as separate channels requiring manual coordination. ActiveCampaign's unified intelligence orchestrates everything automatically.
AI-powered personalization at scale
With ActiveCampaign’s Active Intelligence, you’re able to create highly targeted SMS campaigns based on customer behavior, preferences, purchase history, and engagement patterns, ensuring every message resonates with its recipient.
Advanced automation capabilities
Using customer behavioral data and AI, you’re able to build automations and send texts at the right moment throughout your customer journey.
From welcome sequences and cart abandonment recovery to post-purchase follow-ups and re-engagement campaigns, ActiveCampaign’s automation promises timely, relevant communication without manual intervention.
ActiveCampaign’s key advantages:
- Unified reporting: Email and SMS metrics in one platform eliminates the need for manual data consolidation.
- Advanced attribution: Built-in cross-channel journey tracking shows the complete customer path.
- Real-time optimization: Immediate insights for campaign adjustments without waiting for data exports.
- Integration capabilities: ActiveCampaign's SMS functionality integrates effortlessly with your existing email marketing, CRM, and automation workflows. Seamless data flow with 950+ apps means your SMS data connects to your entire marketing stack.
- Customer success support: Dedicated guidance for SMS metric optimization helps you avoid common pitfalls.
Real-world success: “Why ActiveCampaign is a game changer”
Arts and culture nonprofits face unique communication challenges that require both planned marketing sequences and immediate crisis response capabilities. One customer’s experience demonstrates how ActiveCampaign’s SMS features have transformed their approach to audience engagement, particularly for organizations with ticketing components.
Sydney Lynch, Director of Customer Experience at L2, shares that their primary challenge they encountered was the unreliability of email for time-sensitive communications.
Email is a little unreliable for people to check. You know, that an SMS is gonna be right there on their phone.
When performers get sick and events need to be cancelled at the last minute, reaching ticket holders immediately becomes crucial for customer satisfaction and operational efficiency.
ActiveCampaign’s broadcast SMS feature was the perfect solution, streamlining what was previously a cumbersome process. Rather than building complex automations for urgent, one-off communications, L2 was able to send immediate notifications directly to their audience’s phones.
This capability has proven invaluable for several key scenarios:
- Emergency event cancellations: L2 is able to instantly notify their contacts when performers are unavailable or venues become inaccessible.
- Presale opportunities: They’re able to send exclusive, early access notifications for high-demand tickets (like Bon Jovi).
- Last-minute promotional campaigns: No more scrambling. L2 can send out quick discount offers when Saturday matinee tickets need to be moved.
Beyond crisis management, L2 discovered that SMS-only communications created an exclusive “club” experience for their subscribers, increasing incentive for customers to opt into SMS lists.
SMS metrics aren't just another set of numbers to track—they're a window into more immediate, engaged customer relationships. When you combine SMS insights with your email expertise, you're not just adding a channel—you're multiplying your marketing impact.
Start with the foundation metrics, get comfortable with the differences from email, and then gradually layer in the advanced attribution and optimization strategies. Your email marketing background gives you a huge head start—now it's time to put it to work in the SMS world.
FAQs about SMS marketing metrics
Lingering questions? We’ve got you covered.
How do SMS metrics differ from email metrics in practice?
The biggest differences are in timing and precision. SMS metrics move much faster—you'll see most engagement within hours rather than days. Plus, SMS metrics are more definitive—opened means read, clicked means genuinely interested.
What's a realistic SMS ROI expectation for email marketers?
While individual results vary, SMS typically generates $71 for every dollar spent. When combined with email, many brands see 2-3x improvement in overall campaign ROI compared to email alone.
How quickly can I expect to see meaningful SMS metric data?
Unlike email, where you might wait weeks for trend data, SMS metrics become meaningful within days due to the immediate engagement patterns. Most brands have enough data for optimization decisions within 2-3 campaigns.
Should I track SMS and email metrics separately or together?
Both. Track them separately to understand individual channel performance, but also track them together to understand omnichannel impact. The combined view often reveals insights that individual channel analysis misses.
What SMS metrics correlate most strongly with email performance?
SMS engagement rate correlates strongly with email lifetime value. Subscribers who engage with both channels typically have 40-60% higher LTV than single-channel subscribers.
How do privacy regulations affect SMS metric tracking vs. email?
SMS compliance is stricter upfront (requiring explicit consent), but simpler ongoing (no complex unsubscribe processes). TCPA compliance is non-negotiable, but once you're compliant, tracking is actually more straightforward than email.